David Booth On: Forecasting

By | September 19th, 2019|DFA, Dimensional Fund Advisors, Markets|

Dimensional Founder David Booth shares his perspective on the limitations of market forecasting in this less than two minute video. Instead of enticing people to try to stock-pick, Dimensional wants to educate investors, with the over 90 years of data, on investing in capital markets.

A Tale of Two Decades

By | September 9th, 2019|DFA, Dimensional Fund Advisors, Markets|

Looking at the stock market over the past 20 years, you might think of Charles Dickens: It was the best of times—and the worst. But while the 2000s and 2010s have differed starkly in performance, collectively they have reinforced investing lessons on patience and discipline.

This piece from our partner, Dimensional Funds, discusses the well supported thought that maintaining patience and discipline, through the bad times and the good, puts investors in position to increase the likelihood of long‑term success.

Click here to download A Tale of Two Decades!

…or check it out below:

A Tale of Two Decades_ Lessons for Long-Term Investors

Video Series: Reacting to Markets

By | August 13th, 2019|DFA, Dimensional Fund Advisors, Markets|

This 1 minute video says it all! Nobel laureate Eugene Fama provides perspective for long-term investors on why they shouldn’t pay a lot of attention to short-term results.

“If you have a bad period in the risky part of your portfolio and you get out as a consequence…What that says is you NEVER should have been there!”

The most free way of thinking about investing is understanding what the possibilities are…good or bad.

Video series: What’s the upside of risk?

By | August 7th, 2019|DFA, Dimensional Fund Advisors, Markets, Video|

In this short video, Nobel laureate Eugene Fama discusses how financial markets work, what fuels innovation, and the upside and downside of risk.

Trillion Dollar Club

By | June 10th, 2019|DFA, Dimensional Fund Advisors, Markets|

For 20 years, we have utilized Dimensional Fund Advisors to facilitate intelligent product selection, and our philosophy parallels their approach of information based, efficient investing.

The Financial Times recently sat down with Dimensional Co-CEO and Chief Investment Officer Gerard O’Reilly. The interview covers O’Reilly’s path to Dimensional, his leadership alongside Co-CEO Dave Butler, and the firm’s research-based culture and approach to investing.

An interesting piece about one of DFA’s own, and his path to Dimensional. Read below or click HERE to go directly to Dimensional’s Web site.


dimensional-eyes-the-fund-sectors-trillion-dollar-club


The Uncommon Average

By | May 14th, 2019|DFA, Dimensional Fund Advisors, Markets|

The US stock market has delivered an average annual return of around 10% since 1926.[1] But short-term results may vary, and in any given period stock returns can be positive, negative, or flat. When setting expectations, it’s helpful to see the range of outcomes experienced by investors historically. For example, how often have the stock market’s annual returns actually aligned with its long-term average?

Exhibit 1 shows calendar year returns for the S&P 500 Index since 1926. The shaded band marks the historical average of 10%, plus or minus 2 percentage points. The S&P 500 Index had a return within this range in only six of the past 93 calendar years. In most years, the index’s return was outside of the range—often above or below by a wide margin—with no obvious pattern. For investors, the data highlight the importance of looking beyond average returns and being aware of the range of potential outcomes.

Exhibit 1: S&P 500 Index Annual Returns

1926–2018

In US dollars. S&P data © S&P Dow Jones Indices LLC, a division of S&P Global. Indices are not available for direct investment. Index returns are not representative of actual portfolios and do not reflect costs and fees associated with an actual investment. Past performance is no guarantee of future results. Actual returns may be lower.

TUNING IN TO DIFFERENT FREQUENCIES

Despite the year-to-year volatility, investors can potentially increase their chances of having a positive outcome by maintaining a long-term focus. Exhibit 2 documents the historical frequency of positive returns over rolling periods of one, five, and 10 years in the US market. The data show that, while positive performance is never assured, investors’ odds improve over longer time horizons.

Exhibit 2: Frequency of Positive Returns in the S&P 500 Index

Overlapping Periods: 1926–2018

In US dollars. From January 1926–December 2018, there are 997 overlapping 10-year periods, 1,057 overlapping 5-year periods, and 1,105 overlapping 1-year periods. The first period starts in January 1926, the second period starts in February 1926, the third in March 1926, and so on. S&P data © S&P Dow Jones Indices LLC, a division of S&P Global. Indices are not available for direct investment. Index returns are not representative of actual portfolios and do not reflect costs and fees associated with an actual investment. Past performance is no guarantee of future results. Actual returns may be lower. 

Conclusion

While some investors might find it easy to stay the course in years with above average returns, periods of disappointing results may test an investor’s faith in equity markets. Being aware of the range of potential outcomes can help investors remain disciplined, which in the long term can increase the odds of a successful investment experience. What can help investors endure the ups and downs? While there is no silver bullet, understanding how markets work and trusting market prices are good starting points. An asset allocation that aligns with personal risk tolerances and investment goals is also valuable. By thoughtfully considering these and other issues, investors may be better prepared to stay focused on their long-term goals during different market environments.

QUARTERLY MARKET REVIEW – Q1 2019

By | April 10th, 2019|DFA, Dimensional Fund Advisors, Quarterly Market Review|

Click on the link below for a detailed analysis of quarterly performance of the global equity and fixed income markets.

CLICK HERE TO READ THE 1ST QUARTER 2019- QUARTERLY MARKET REVIEW

Getting to the Point of a Point

By | March 15th, 2019|DFA, Dimensional Fund Advisors, Markets|

A quick online search for “Dow rallies 500 points” yields a cascade of news stories with similar titles, as does a similar search for “Dow drops 500 points.”

These types of headlines may make little sense to some investors, given that a “point” for the Dow and what it means to an individual’s portfolio may be unclear. The potential for misunderstanding also exists among even experienced market participants, given that index levels have risen over time and potential emotional anchors, such as a 500-point move, do not have the same impact on performance as they used to. With this in mind, we examine what a point move in the Dow means and the impact it may have on an investment portfolio.

Impact of index construction

The Dow Jones Industrial Average was first calculated in 1896 and currently consists of 30 large cap US stocks. The Dow is a price-weighted index, which is different than more common market capitalization-weighted indices.

An example may help put this difference in weighting methodology in perspective. Consider two companies that have a total market capitalization of $1,000. Company A has 1,000 shares outstanding that trade at $1 each, and Company B has 100 shares outstanding that trade at $10 each. In a market capitalization-weighted index, both companies would have the same weight since their total market caps are the same. However, in a price-weighted index, Company B would have a larger weight due to its higher stock price. This means that changes in Company B’s stock would be more impactful to a price-weighted index than they would be to a market cap-weighted index.

The relative advantages and disadvantages of these methodologies are interesting topics themselves, but the main purpose of discussing the differences in this context is to point out that design choices can have an impact on index performance. Investors should be aware of this impact when comparing their own portfolios’ performance to that of an index.

Headlines vs. reality

Movements in the Dow are often communicated in units known as points, which signify the change in the index level. Investors should be cautious when interpreting headlines that reference point movements, as a move of, say, 500 points in either direction is less meaningful now than in the past largely because the overall index level is higher today than it was many years ago.

Exhibit 1 plots what a decline of this magnitude has meant in percentage terms over time. A 500-point drop in January 1985, when the Dow was near 1,300, equated to a nearly 39% loss. A 500-point drop in December 2003, when the Dow was near 10,000, meant a much smaller 5% decline in value. And a 500-point drop in early December 2018, when the Dow hovered near 25,000, resulted in a 2% loss.

Exhibit 1.       Hypothetical 500-Point Decline of the Dow Measured in Percentage Terms

How does the dow relate to your portfolio?

While the Dow and other indices are frequently interpreted as indicators of broader stock market performance, the stocks composing these indices may not be representative of an investor’s total portfolio.

For context, the MSCI All Country World Investable Market Index (MSCI ACWI IMI) covers just over 8,700 large, mid, and small cap stocks in 23 developed and 24 emerging markets countries with a combined market cap of more than $50 trillion. The S&P 500 includes 505 large cap US stocks with approximately $23.8 trillion in combined market cap. The Dow is a collection of 30 large cap US stocks with a combined market cap of approximately $6.8 trillion.

Exhibit 2.       Performance of MSCI ACWI IMI, S&P 500, and Dow by Calendar Year

Dow Jones and S&P 500 data © 2019 S&P Dow Jones Indices LLC, a division of S&P Global. All rights reserved. MSCI data © MSCI 2019, all rights reserved. MSCI ACWI IMI is the MSCI All Country World Investable Market Index (net dividends). Their performance does not reflect fees and expenses associated with the management of an actual portfolio. Past performance is no guarantee of future results.

It is also important to note that some investors may be concerned about other asset classes besides stocks. Depending on investor needs, a diversified portfolio may include a mix of global stocks, bonds, commodities, and any number of other assets not represented in a stock index. A portfolio’s performance should always be evaluated within the context of an investor’s specific goals. Understanding how a personal portfolio compares to broadly published indices like the Dow can give investors context about how headlines apply to their own situation.

Conclusion

News headlines are often written to grab attention. A headline publicizing a 500-point move in the Dow may trigger an emotional response and, depending on the direction, sound either exciting or ominous enough to warrant reading the article. However, after digging further, we can see that the insights such headlines offer may be limited, especially if investors hold portfolios designed and managed daily to meet their individual goals, needs, and preferences in a broadly diversified and cost-effective manner.

Income Calculator – Translating Your Savings to Retirement Income

By | March 1st, 2019|DFA, Dimensional Fund Advisors, Retirement|

Focusing on INCOME when investing for retirement, and following a strategy that addresses the RISKS that can affect your future income and standard of living is extremely important! Many are saving and investing to support future spending, but most are focused on a magic number, not the income that a that number can support. Ask yourself…

How much income should I expect my retirement savings to generate once I stop working? When thinking about retirement, understanding how much income you can expect makes planning easier, and having a clear picture of where you are today can help you make informed decisions that can influence your future.

THIS CALCULATOR is designed to help give you a sense of how much income your savings may provide in retirement based on several inputs and an assumed asset allocation that shifts over time.

RETIREMENT INCOME CALCULATOR

If you would like to see how this calculator can fit within an overall retirement plan, please feel free to reach out to our office today!!

Déjà Vu All Over Again

By | February 20th, 2019|DFA, Dimensional Fund Advisors, Markets|

Investment fads are nothing new. When selecting strategies for their portfolios, investors are often tempted to seek out the latest and greatest investment opportunities. Over the years, these approaches have sought to capitalize on developments such as the perceived relative strength of particular geographic regions, technological changes in the economy, or the popularity of different natural resources. But long-term investors should be aware that letting short-term trends influence their investment approach may be counterproductive.

“There’s one robust new idea in finance that has

investment implications maybe every 10 or 15 years,

but there’s a marketing idea every week.” Nobel laureate Eugene Fama

What’s Hot Becomes What’s Not

Let’s look back at some investment fads over the decades:

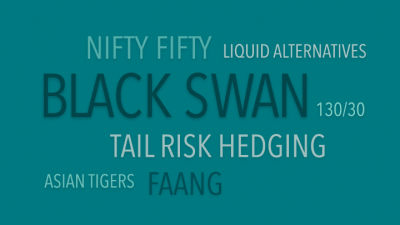
1950’s – the “Nifty Fifty” (50 hot companies) were all the rage.

1960s – “go-go” stocks and funds piqued investor interest.

Late 20th century – emergence of a “new economy”

1990s – attention turned to the rising “Asian Tigers” of Hong Kong, Singapore, South Korea, and Taiwan.

2000’s – “BRIC” countries of Brazil, Russia, India, and China and their new place in global markets.

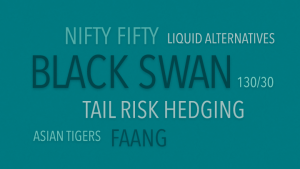
In the wake of the 2008 financial crisis – “Black Swan” funds, “tail-risk-hedging” strategies, and “liquid alternatives” abounded.

Recently – peer-to-peer lending, cryptocurrencies, and even cannabis cultivation

The Fund Graveyard
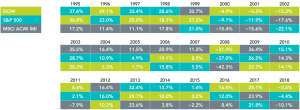
Unsurprisingly, however, numerous funds across the investment landscape were launched over the years only to subsequently close and fade from investor memory. While economic, demographic, technological, and environmental trends shape the world we live in, public markets aggregate a vast amount of dispersed information and drive it into security prices. Any individual trying to outguess the market by constantly trading in and out of what’s hot is competing against the extraordinary collective wisdom of millions of buyers and sellers around the world.

With the benefit of hindsight, it is easy to point out the fortune one could have amassed by making the right call on a specific industry, region, or individual security over a specific period. While these anecdotes can be entertaining, there is a wealth of compelling evidence that highlights the futility of attempting to identify mispricing in advance and profit from it.

It is important to remember that many investing fads, and indeed, most mutual funds, do not stand the test of time. A large proportion of funds fail to survive over the longer term. Of the 1,622 fixed income mutual funds in existence at the beginning of 2004, only 55% still existed at the end of 2018. Similarly, among equity mutual funds, only 51% of the 2,786 funds available to US-based investors at the beginning of 2004 endured.

What Am I Really Getting?
When confronted with choices about whether to add additional types of assets or strategies to a portfolio, it may be helpful to ask the following questions:

1. What is this strategy claiming to provide that is not already in my portfolio?

2. If it is not in my portfolio, can I reasonably expect that including it or focusing on it will increase expected returns, reduce expected volatility, or help me achieve my investment goal?

3. Am I comfortable with the range of potential outcomes? 

If investors are left with doubts after asking any of these questions, it may be wise to use caution before proceeding. In addition, there is no shortage of things investors can do to help contribute to a better investment experience. Working closely with a financial advisor can help individual investors create a plan that fits their needs and risk tolerance. Pursuing a globally diversified approach; managing expenses, turnover, and taxes; and staying disciplined through market volatility can help improve investors’ chances of achieving their long-term financial goals.

Conclusion
Fashionable investment approaches will come and go, but investors should remember that a long-term, disciplined investment approach based on robust research and implementation may be the most reliable path to success in the global capital markets.

Load More Posts