


Manic Monday (Tuesday, Wednesday, Thursday, Friday)
I’d like to share today’s insights from Schwab Chief Investment Strategist Liz Ann Sonders in response to the economic implications of COVID-19 and the recent crash in oil prices: Manic Monday (Tuesday, Wednesday, Thursday, Friday).
I hope these insights help you navigate the current market volatility. Please reach out with questions or for more information.

January Performance Dashboard
- U.S. equities started the year strongly, but gains were erased towards the end of the month as a result of coronavirus fears. The S&P 500® was flat in January, while smaller-caps lagged, with the S&P MidCap 400® and the S&P SmallCap 600® down 3% and 4%, respectively.
- International markets declined, with the S&P Developed Ex-U.S BMI and S&P Emerging BMI down 2% and 4%, respectively.
- Low Volatility was the top performing factor; not unrelatedly, Utilities was the top performing sector with Real Estate close behind. Similarly, Momentum and Growth were the next best factor index performers, while Info Tech and Communication Services were the second and fourth best performing sectors. Meanwhile, in a reversal from last year’s outperformance, Value lagged Growth.

Year-End Performance Dashboard
- In sharp contrast to last year, U.S. equities triumphed in 2019, with the S&P 500® up 31%, its biggest annual gain since 2013. Easing trade tensions and Fed accommodation renewed optimism about the economic outlook. Mega-caps dominated as gains for the S&P MidCap 400® and the S&P SmallCap 600®, 26% and 23% respectively, lagged the S&P 500.
- International markets also gained, with the S&P Developed Ex-U.S BMI up 23% and the S&P Emerging BMI up 20%.
- High Beta was the best performing factor, followed by Quality; not unrelatedly, Information Technology was the best performing sector, up a remarkable 50%. Meanwhile, Value outperformed Growth for the first time in three years.
November Performance Dashboard
-
Amid optimism that U.S.-China trade issues will be resolved amicably, U.S. equities showed strength in November. The S&P 500® was up 4%, its biggest monthly gain since June, while the S&P SmallCap 600® and the S&P MidCap 400® gained 3%.
-
International markets also gained, with the S&P Developed Ex-U.S BMI up 1%.
-
The resurgence in Value continued, as Enhanced Value was the best performing factor. Year-to-date, Quality was the top performing factor index, up an impressive 29%; not unrelatedly, Information Technology was the best performing sector.

Video series: Retirement Readiness #3 – How should I Invest?
How much retirement income can YOUR portfolio support? Have you considered interest rate and inflation risk? Focusing on a final number doesn’t tell the whole story. It’s important to have discussions with a financial planner about income streams and cost of living in your retirement years.

Top 8 Reasons to Choose a Solo 401k – SIGN UP BELOW BY 12/31/19!
8 REASONS TO BEAT THE DEADLINE! SIGN UP FOR A CONSULTATION HERE!
Solo 401ks are cost-effective, powerful retirement vehicles. They are designed for self-employed workers who have no employees other than a spouse. They allow small-business owners to stash away much more for retirement than they could stash in a traditional IRA or a SEP IRA, while avoiding the expense and paperwork of setting up a full traditional 401(k) plan.
1) Generous Contribution Limits
For the plan year 2019, a participant under the age of 50 can make a maximum employee deferral in the amount of $19,000. This is also called an “employee” contribution. Age 50+ can contribute up to $25,000.
2) Ability to Self-Direct

With a Solo 401k, you can act as your own trustee. This eliminates the need for a bank or trust company to serve as a trustee. The plan participant (you) is in control of the plan.
We have established many Solo 401k’s for individuals in our firm. Charles Schwab’s user friendly platform makes it easy to save aggressively.
3) Profit Sharing Provision
On top of the allowed employee deferral, the participant can also contribute up to 25 percent of total compensation to a profit-sharing component of the plan. This is often called an “employer” contribution.
Total combined plan contributions (employer and employee) cannot exceed the lower of $57,000 or 100 percent of compensation (plus any catch-up contributions if over the age of 50).
4) Contributions are Elective
Contributions to a solo 401k plan are entirely discretionary. A participant has the option of contributing to the plan and can reduce or even suspend plan contributions as necessary.
5) Ability to Take Out a Loan
A solo 401k allows participants to borrow up to $50,000 or 50% of their vested account value (whichever is lower). This loan can be made for any purpose with a payback period of up to 5 years.

This offers significant flexibility and provides flexibility against having to take a withdrawal that would be subject to a tax penalty. This flexibility is in contrast to an IRA that offers no participant loan feature.
6) Minimal Tax Filing Requirements
There are no annual filing requirements unless the solo 401k plan exceeds $250,000 in assets. The Solo 401k is extremely easy to administer.
7) Roth Contributions
Solo 401ks can include a Roth component. Just like Roth IRA contributions, Roth 401k contributions are made on an after-tax basis. Unlike a pre-tax contribution, there is no upfront tax deduction. However, a distribution of Roth 401k contributions (along with earnings) is tax-free.
Individual taxpayers are disallowed from contributing to a Roth IRA based on income restrictions. These same restrictions do not apply to Roth 401k contributions. A Roth 401k contribution has the same limitation as an employee deferral of $19,000. This is substantially more than the limit of a Roth IRA.
8) Rollover Provision
One key advantage is rollover flexibility. A solo 401k can accept rollovers from other retirement accounts, such as an IRA, a SEP, or a 401k from a prior employer. However, Roth IRAs cannot be rolled into a solo 401k.
SIGN UP FOR A FREE CONSULTATION BEFORE DECEMBER 31ST!
Solo 401ks are cost-effective, powerful retirement vehicles. They are designed for self-employed workers who have no employees other than a spouse. They allow small-business owners to stash away much more for retirement than they could stash in a traditional IRA or a SEP IRA, while avoiding the expense and paperwork of setting up a full traditional 401(k) plan.
1) Generous Contribution Limits
For the plan year 2019, a participant under the age of 50 can make a maximum employee deferral in the amount of $19,000. This is also called an “employee” contribution. Age 50+ can contribute up to $25,000.
2) Ability to Self-Direct
With a Solo 401k, you can act as your own trustee. This eliminates the need for a bank or trust company to serve as a trustee. The plan participant (you) is in control of the plan.
We have established many Solo 401k’s for individuals in our firm. Charles Schwab’s user friendly platform makes it easy to save aggressively.
3) Profit Sharing Provision
On top of the allowed employee deferral, the participant can also contribute up to 25 percent of total compensation to a profit-sharing component of the plan. This is often called an “employer” contribution.
Total combined plan contributions (employer and employee) cannot exceed the lower of $57,000 or 100 percent of compensation (plus any catch-up contributions if over the age of 50).
4) Contributions are Elective
Contributions to a solo 401k plan are entirely discretionary. A participant has the option of contributing to the plan and can reduce or even suspend plan contributions as necessary.
5) Ability to Take Out a Loan
A solo 401k allows participants to borrow up to $50,000 or 50% of their vested account value (whichever is lower). This loan can be made for any purpose with a payback period of up to 5 years.
This offers significant flexibility and provides flexibility against having to take a withdrawal that would be subject to a tax penalty. This flexibility is in contrast to an IRA that offers no participant loan feature.
6) Minimal Tax Filing Requirements
There are no annual filing requirements unless the solo 401k plan exceeds $250,000 in assets. The Solo 401k is extremely easy to administer.
7) Roth Contributions
Solo 401ks can include a Roth component. Just like Roth IRA contributions, Roth 401k contributions are made on an after-tax basis. Unlike a pre-tax contribution, there is no upfront tax deduction. However, a distribution of Roth 401k contributions (along with earnings) is tax-free.
Individual taxpayers are disallowed from contributing to a Roth IRA based on income restrictions. These same restrictions do not apply to Roth 401k contributions. A Roth 401k contribution has the same limitation as an employee deferral of $19,000. This is substantially more than the limit of a Roth IRA.
8) Rollover Provision
One key advantage is rollover flexibility. A solo 401k can accept rollovers from other retirement accounts, such as an IRA, a SEP, or a 401k from a prior employer. However, Roth IRAs cannot be rolled into a solo 401k.
SIGN UP FOR A FREE CONSULTATION BEFORE DECEMBER 31ST!

Video series: Retirement Readiness #1 – Monitoring Your Progress
When planning for retirement, it’s important to keep in mind how much spending your savings can support. The decisions you make today can help improve your retirement readiness.
Beyond determining how much money to save, it’s useful to think about retirement in terms of how much income you’ll need after you stop working. Dimensional’s My Retirement Income Calculator can help give you a sense of how much income your savings could provide in retirement.
Enjoy our Retirement Readiness series to help you set and achieve your retirement goals.
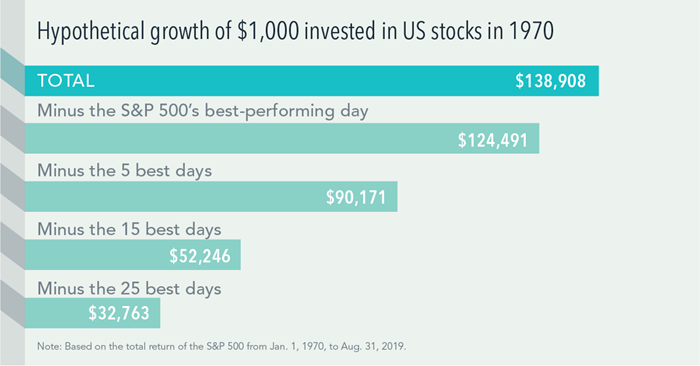
What Happens When you Fail at Market Timing?
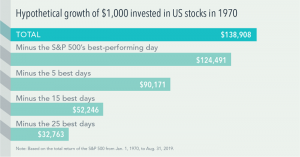
The impact of missing just a few of the market’s best days can be profound, as this look at a hypothetical investment in the stocks that make up the S&P 500 Index shows. A hypothetical $1,000 turns into $138,908 from 1970 through the end of August 2019. Miss the S&P 500’s five best days and that’s $90,171. Miss the 25 best days and the return dwindles to $32,763. There’s no proven way to time the market—targeting the best days or moving to the sidelines to avoid the worst—so history argues for staying put through good times and bad. Investing for the long term helps to ensure that you’re in the position to capture what the market has to offer.
October Performance Dashboard
-
U.S. equities posted gains in October, bolstered by optimism around trade talks with China, strong earnings, and easing from the Fed, although Chairman Powell signaled a likely pause on future rate cuts. The S&P 500® and the S&P SmallCap 600® both gained 2%, while the S&P MidCap 400® gained 1%.
-
International markets also gained, with the S&P Developed Ex-U.S. and the S&P Emerging BMI both up 4%.
-
Enhanced Value continued to outperform in October, and Value again outperformed Growth. Year-to-date, Low Volatility remains the top performing factor index, up an impressive 26%.