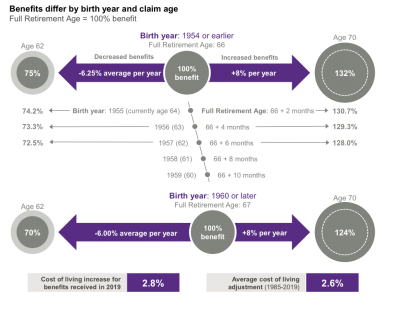
Deciding when to claim benefits will have a permanent impact on the benefit you receive. Claiming before your full retirement age can significantly reduce your benefit, while delaying increases it. In 2017, full retirement age began transitioning from 66-67 by adding 2 months each year for 6 years. This makes claiming early even more of a benefit reduction.
Surprisingly few Americans understand the benefits and trade-offs related to claiming Social Security at various ages. The top graphic illustrates these trade-offs for people who are currently 65 and older whose full retirement age (FRA) is 66. Delaying benefits results in a much higher benefit amount: Waiting to age 70 results in 32% more in a benefit check than taking benefits at FRA. Likewise, taking benefits early will lower the benefit amount. At age 62, beneficiaries would have received only 75% of what they would get if they waited until age 66. FRA for individuals turning 62 in 2019 is 66 and 6 months, and it will continue to move 2 months every year until 2023, when it will reach and remain at age 67. The Social Security Amendments Act of 1983 increased FRA from 65 to 67 over a 40-year period. The first phase of transition increased FRA from 65 to 66 for individuals turning 62 between 2000 and 2005. After an 11-year hiatus, the transition from 66 to 67 will complete the move.
The bottom graphic shows the trade-offs for younger individuals, which will penalize early claiming to a greater degree. The percentages shown are “real” amounts – cost-of-living adjustments (COLA) will be added on top, providing an even greater difference between the actual dollar benefits one would receive. The average annual COLA for the past 34 years has been 2.6%.


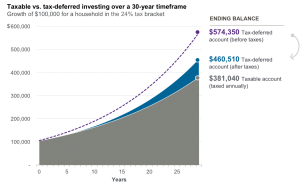 Deferring the tax on investment earnings, such as dividends, interest or capital gains, may help accumulate more after-tax wealth over time than earning the same return in a taxable account. This is known as tax-deferred compounding. This chart shows an initial $100,000 after-tax investment in either a taxable or tax-deferred account that earns a 6% return (assumed to be subject to ordinary income taxes). Assuming an income tax rate of 24%, the value of the tax-deferred account (net of taxes owed) after 30 years accumulates over $79,000 more than if the investment return had been taxed 24% each year.