

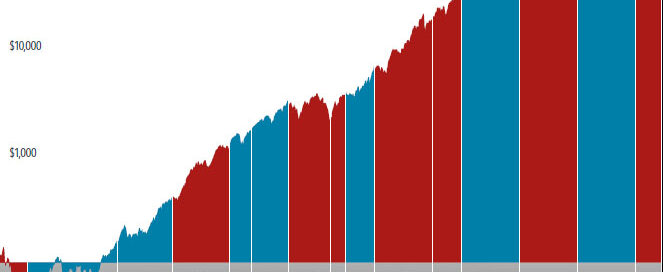
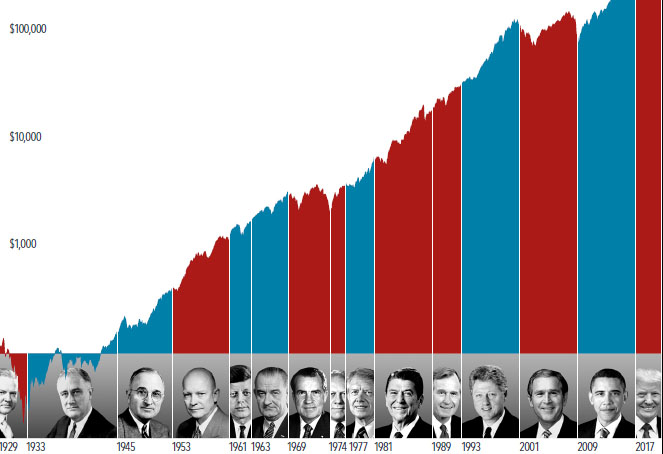
How Much Impact Does the President Have on Stocks?
Click HERE to download this interactive exhibit that examines market and economic data for nearly 100 years of US presidential terms.

U.S. Equity Performance Dashboard – July 2020
In spite of weak macroeconomic data and fears of a resurgence of COVID-19, U.S. equities continued their rally in July, aided by Fed stimulus and strong earnings results The S&P 500® gained by 6%, while the S&P MidCap 400® and the S&P SmallCap 600® gained by 5% and 4%, respectively. The total return for the S&P 500 is now modestly positive year to date. Volatility declined, with the VIX® closing the month at 24.46. International markets also gained, with [...]
U.S. Performance Dashboard – April 2020
After March's carnage, U.S. equities roared back in April, driven by fiscal stimulus and the apparent slowing of the spread of COVID-19. The S&P 500® gained by 13%, the best monthly performance since January 1987. In a reversal from the recent past, mid-caps performed even better, with the S&P MidCap 400® up 14%. While still relatively high, volatility calmed, with the VIX® closing the month at 34.15. International markets also recovered, with the S&P Developed Ex-U.S. BMI and [...]
U.S. Performance Dashboard – March 2020
Global markets in Q1 were devastated by the coronavirus pandemic. U.S. equities posted their worst quarter since 2008, with the S&P 500® down 20%; smaller-caps performed even worse, with the S&P MidCap 400® and the S&P SmallCap 600® down 30% and 33%, respectively. Volatility rose, with the VIX® closing at a record high of 82.69 on March 16th. International markets were not spared, with the S&P Developed Ex-U.S. BMI and S&P Emerging BMI down 24% and 25%, respectively. [...]


