Park + Elm Investing Principle #10: Focus on What You can Control!

By | December 10th, 2018|Markets|

#10 is HERE!

Download our Ebook Here to get the first 9 principles!!

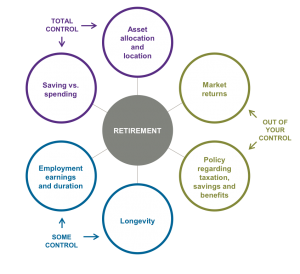
Financial science and experience show that our investment efforts are best directed toward areas where we can make a difference and away from things we can’t control. We can’t control movements in the market. We can’t control news or financial headlines. No one can reliably forecast the market’s direction or predict which stock or investment manager will outperform.

But each of us can control how much risk we take. We can diversify those risks across different assets, companies, sectors, and countries. We do have a say in the fees we pay. We can influence transaction costs. And we can exercise discipline when our emotional impulses threaten to blow us off-course.

These principles are difficult for most people, because we are programmed to think that if we pay closer attention to the day-to-day noise, we will get better results. Ultimately, we are pushed toward fads that the financial marketing industry decides are sellable, which require us to constantly tinker with our portfolios. The financial media emphasis is often on the excitement induced by constant activity and chasing past returns, rather than on the desired end result.

So what can we control?

  1. Risk – Identify an acceptable level of risk for an acceptable return. We use Riskalyze cutting-edge technology to identify risk tolerance and align your portfolio with your investment goals and expectations. Run stress tests and understand what your risk tolerance means for your portfolio over time.
  2. Expenses – Every investor has a say in the fees they pay. Think of the costs as a percentage of your return that you give away. If you’re invested in a fund that returns 5%, but charges a 1% expense ratio, then you lose 20% of your return to fees.
  3. Diversify your portfolio – Diversification improves the odds of holding the best performers, and by holding a globally diversified portfolio, investors are positioned to capture returns wherever they occur.
  4. Minimize the taxes you pay – High turnover strategies can leave you with a big tax bill in the spring. Efficiency in investing is a controllable way to save tax dollars.
  5. Discipline – It never feels good to watch the markets go down, but it’s also part of being an investor. No one can accurately time the highs and lows. Avoid the temptation to make changes to your portfolio in response to ever-changing market conditions.

A financial advisor can create a plan tailored to your personal financial needs while helping you focus on actions that add value. An evaluation of the risk and fees in your portfolio is a perfect first step toward a significantly better investment experience. Contact us if you’d like a free assessment of expenses and risk in your current portfolio.

Why Should You Diversify?

By | December 4th, 2018|Markets|

As 2019 approaches, and with US stocks outperforming non-US stocks in recent years, some investors have again turned their attention towards the role that global diversification plays in their portfolios.

For the five-year period ending October 31, 2018, the S&P 500 Index had an annualized return of 11.34% while the MSCI World ex USA Index returned 1.86%, and the MSCI Emerging Markets Index returned 0.78%. As US stocks have outperformed international and emerging markets stocks over the last several years, some investors might be reconsidering the benefits of investing outside the US.

While there are many reasons why a US-based investor may prefer a degree of home bias in their equity allocation, using return differences over a relatively short period as the sole input into this decision may result in missing opportunities that the global markets offer. While international and emerging markets stocks have delivered disappointing returns relative to the US over the last few years, it is important to remember that:

  1. Non-US stocks help provide valuable diversification benefits.
  2. Recent performance is not a reliable indicator of future returns.

there’s a world of opportunity in equities

The global equity market is large and represents a world of investment opportunities. As shown in Exhibit 1, nearly half of the investment opportunities in global equity markets lie outside the US. Non-US stocks, including developed and emerging markets, account for 48% of world market capitalization and represent thousands of companies in countries all over the world. A portfolio investing solely within the US would not be exposed to the performance of those markets.

Exhibit 1.       World Equity Market Capitalization

As of December 31, 2017. Data provided by Bloomberg. Market cap data is free-float adjusted and meets minimum liquidity and listing requirements. China market capitalization excludes A-shares, which are generally only available to mainland China investors. For educational purposes; should not be used as investment advice.

the lost decade

Exhibit 2.       Global Index Returns, January 2000–December 2009

S&P data © 2018 S&P Dow Jones Indices LLC, a division of S&P Global. All rights reserved. MSCI data © MSCI 2018, all rights reserved. Indices are not available for direct investment. Index performance does not reflect expenses associated with the management of an actual portfolio. Past performance is not a guarantee of future results.

pick a country?

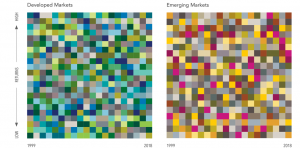
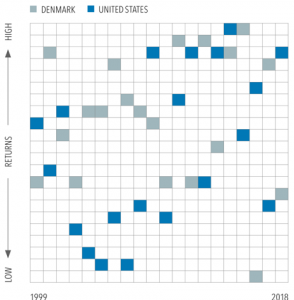
Are there systematic ways to identify which countries will outperform others in advance? Exhibit 3 illustrates the randomness in country equity market rankings (from highest to lowest) for 22 different developed market countries over the past 20 years. This graphic conveys how difficult it would be to execute a strategy that relies on picking the best country and the resulting importance of diversification.

Exhibit 3.       Equity Returns of Developed Markets

Source: MSCI country indices (net dividends) for each country listed. Does not include Israel, which MSCI classified as an emerging market prior to May 2010. MSCI data © MSCI 2018, all rights reserved. Past performance is no guarantee of future results. Indices are not available for direct investment; therefore, their performance does not reflect the expenses associated with the management of an actual portfolio.

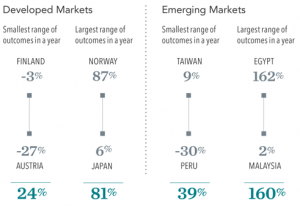
In addition, concentrating a portfolio in any one country can expose investors to large variations in returns. The difference between the best- and worst‑performing countries can be significant. For example, since 1998, the average return of the best‑performing developed market country was approximately 44%, while the average return of the worst-performing country was approximately –16%. Diversification means an investor’s portfolio is unlikely to be the best or worst performing relative to any individual country, but diversification also provides a means to achieve a more consistent outcome and more importantly helps reduce and manage catastrophic losses that can be associated with investing in just a small number of stocks or a single country.

a diversified approach

Over long periods of time, investors may benefit from consistent exposure in their portfolios to both US and non‑US equities. While both asset classes offer the potential to earn positive expected returns in the long run, they may perform quite differently over short periods. While the performance of different countries and asset classes will vary over time, there is no reliable evidence that this performance can be predicted in advance. An approach to equity investing that uses the global opportunity set available to investors can provide diversification benefits as well as potentially higher expected returns.

At Park + Elm, we have cutting edge technology that can gauge the overall risk of your portfolio (to match your investment risk tolerance), and analyze your asset allocation to measure diversification. If you’d like to discuss your risk and allocation, Contact us TODAY!

Park + Elm Investing Principle #9: Look Beyond the Headlines

By | November 26th, 2018|Dimensional Fund Advisors, Markets|

PRINCIPLE #9 IS HERE!

Look Beyond the Headlines!!

Download the rest of our Ebook Here to get all 10 principles!!

Daily market news and commentary can challenge your investment discipline. Some messages stir anxiety about the future while others tempt you to chase the latest investment fad. When tested, consider the source and maintain a long-term perspective.

Why doesn’t the media run more good news? Because bad news sells! It sells because fear is a more powerful emotion than greed. If people preferred good news, the media would supply it. Newspaper editors know it, which is why the front pages are often so depressing.

When the readers are investors, the danger can come when the emotions generated by bad news prompt them to make changes to their portfolios, unaware that the news is likely already built into market prices. For the individual investor seeking to make portfolio decisions based on news, this presents a real challenge. First, to profit from news you need to be ahead of the market. Second, you have to anticipate how the market will react. This does not sound like a particularly reliable investment strategy. Take, for instance, these headlines from the last presidential election:

Trump’s win turns stock market into shock market, CBS News

A Trump win means recession, stock market crash , CNBC

Yet after some brief jitters following Trump’s win, the stock market kept marching skyward. By the time Trump clinched the presidency, the market rallied and closed the trading day 256 points higher, and continued the rally for 2 years. From Trump’s election to Mid-term elections, the S&P 500 gained nearly 25%.

Take also the summer of 2015, when Greece was on a fast track to bankruptcy. Media around the world described the financial crisis to come in Greece, yet the following year, Greece was the #1 performing stock market in the world.

Conversely, what about those EXTREME jackpot prediction headlines:

Six Stocks to Kick Start Your Portfolio

Make Money in Any Market

12-Month Get Rich Plan

In early 2013, the Daily Mail in the UK carried the headline, “Gold Set to Shine Even More Brightly in 2013.” The rationale was that with investors scouring the world for “safe havens,” gold could reach as high as $2,500 an ounce by year end. As it turned out, gold suffered its biggest annual loss in three decades that year, with its spot price falling 28% in US dollar terms. From an all-time high of $1,920 in September 2011, gold fell to just over $1,200 by the end of 2013.

The notion that the path to long-term wealth lies in locating secret and previously undiscovered treasures in the global marketplace of securities is one regularly featured in media and market commentary. It’s a haphazard approach, reliant on chance and requiring a lot of work that is unlikely to be rewarded. Worse, it means taking unnecessary risks by tying one’s fortunes to a handful of securities or to one or two sectors.

A BETTER APPROACH

Luckily, there is better approach to investing. It involves working with the market and accepting that news is quickly built into prices. Those prices, which are forever changing, reflect the collective views of all market participants and reveal information about expected returns. So instead of trying to second-guess the market by predicting news, investors can use the information already reflected in prices to build diverse portfolios based on the dimensions that drive higher expected returns.

WHAT SHOULD YOU DO?

Sound investment boils down to a handful of principles – accepting that markets work, understanding that risk and return are related, diversifying, keeping costs low and maintaining a long-term perspective. You should turn off MSNBC and Mad Money and work with an Adviser to develop an investment strategy that fits YOUR financial goals for your family and retirement.

Today’s Video: Retirement Rediness – How to Invest!

By | November 19th, 2018|Markets|

Focusing on INCOME when investing for retirement, and following a strategy that addresses the RISKS that can affect your future income and standard of living is extremely important! Many are saving and investing to support future spending, but most are focused on a magic number, not the income that a that number can support. Check out this short but informative clip on developing an income focused plan!

It’s Enrollment Time! Here’s What you Need to Know!

By | November 13th, 2018|Markets|

Fall is open enrollment in the American workplace, and you’ve probably already received you packets, forms, memos, meeting invites and apps for the benefits enrollment season. Navigating your benefits package can be overwhelming, and has a direct effect on your long-term savings. Park + Elm wants to help. Below is your quick guide to navigating your benefits booklet from start to finish:

Health Insurance – pay close attention to the following variables to the health insurance options:

  • Coverage – compare what’s covered to your anticipated needs, i.e. maternity?
  • Co-payments and Prescriptions – if you go to the doctor often, or have a recurring prescription to fill, evaluate these fees closely.
  • Deductibles – the amount you have to pay out of your pocket before coverage begins. A high deductible plan typically means lower premiums, but participants pay more out of pocket if an unexpected illness occurs.
  • Premiums – the monthly fee for coverage. A higher premium usually means lower deductibles, co-pays and more coverage. But that’s not always the best financial choice.

Tax advantaged accounts – beyond health coverage, these accounts allow you to save pre-tax dollars for ancillary health and other expenses.

  • FSA (Flexible Savings Account) – similar in tax savings, a FSA allows you to use the funds for medical and child care services. There are limits to contributions and to carry over funds.
  • HSA (Health Savings Account) – contribute to this account to help cover medical expenses you are paying out of pocket. Choosing a high deductible plan warrants opening an HSA due to the anticipated higher out of pocket costs. These funds roll over from year-to-year.

Vision and Dental – Simply put…

  • Dental care is expensive. Insurance doesn’t cover a lot, but what it does cover usually outweighs the cost of the dental care without it.
  • Vision care is inexpensive, but sometimes unnecessary. If you have healthy eyes you need a checkup only every 2 years, so vision premiums may not be worth it.

Life and Disability – Important Voluntary Benefits!!!

  • Short-term Disability – are you covered for a short-term illness or injury?
  • Long-term Disability – if you are unable to work for an extended period of time, how will you pay your bills?
  • Life Insurance – How much should you leave your family if something happens to you?

401(k) – the likely #1 source of retirement savings, this benefit is the major player in your ability to retire. (Please Note: Contribution Limits are increased for 2019)

  • Make a goal to increase your contributions every year
  • Take full advantage of your employer’s match
  • Make catch-up contributions if you are eligible
  • Evaluate the need to defer some of your funds to a Roth 401(k) to provide future tax diversification.
  • Evaluate your risk tolerance and allocate appropriately
  • Choose low-cost funds

The best way to make the most of open enrollment is to simply set aside adequate time to review all your options carefully and ask any questions you may have. Consult with your financial advisor, as these benefits choices will affect your long-term savings. To make the most of open enrollment, read the fine print, consider your family’s needs and make an educated, rather than a rash, decision. We are here to help you navigate these important choices. Please let us know if you would like a more detailed COMPLIMENTARY REVIEW of your benefits booklet!

Midterm Elections: What Do They Mean for Markets?

By | November 2nd, 2018|Markets|

It’s almost Election Day in the US once again. For those who need a brief civics refresher, every two years the full US House of Representatives and one-third of the Senate are up for reelection.

While the outcomes of the elections are uncertain, one thing we can count on is that plenty of opinions and prognostications will be floated in the days to come. In financial circles, this will almost assuredly include any potential for perceived impact on markets. But should long-term investors focus on midterm elections?

MARKETS WORK

We would caution investors against making short-term changes to a long-term plan to try to profit or avoid losses from changes in the political winds. For context, it is helpful to think of markets as a powerful information-processing machine. The combined impact of millions of investors placing billions of dollars’ worth of trades each day results in market prices that incorporate the aggregate expectations of those investors. This makes outguessing market prices consistently very difficult. While surprises can and do happen in elections, the surprises don’t always lead to clear-cut outcomes for investors.

The 2016 presidential election serves as a recent example of this. There were a variety of opinions about how the election would impact markets, but many articles at the time posited that stocks would fall if Trump were elected. The day following President Trump’s win, however, the S&P 500 Index closed 1.1% higher. So even if an investor would have correctly predicted the election outcome (which was not apparent in pre-election polling), there is no guarantee that they would have predicted the correct directional move, especially given the narrative at the time.

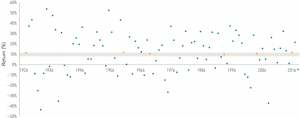
But what about congressional elections? For the upcoming midterms, market strategists and news outlets are still likely to offer opinions on who will win and what impact it will have on markets. However, data for the stock market going back to 1926 shows that returns in months when midterm elections took place did not tend to be that different from returns in any other month.

Exhibit 1 shows the frequency of monthly returns (expressed in 1% increments) for the S&P 500 Index from January 1926–August 2018. Each horizontal dash represents one month, and each vertical bar shows the cumulative number of months for which returns were within a given 1% range (e.g., the tallest bar shows all months where returns were between 1% and 2%). The blue and red horizontal lines represent months during which a midterm election was held, with red meaning Republicans won or maintained majorities in both chambers of Congress, and blue representing the same for Democrats. Striped boxes indicate mixed control, where one party controls the House of Representatives, and the other controls the Senate, while gray boxes represent non-election months. This graphic illustrates that election month returns were well within the typical range of returns, regardless of which party won the election. Results similarly appeared random when looking at all Congressional elections (midterm and presidential) and for annual returns (both the year of the election and the year after).

Exhibit 1.       Midterm Elections and S&P 500 Index Returns, Histogram of Monthly Returns
January 1926–August 2018

Past performance is not a guarantee of future results. Indices are not available for direct investment; therefore, their performance does not reflect the expenses associated with the management of an actual portfolio. S&P data © 2018 S&P Dow Jones Indices LLC, a division of S&P Global. All rights reserved.

IN IT FOR THE LONG HAUL

While it can be easy to get distracted by month-to-month or even one-year returns, what really matters for long-term investors is how their wealth grows over longer periods of time. Exhibit 2 shows the hypothetical growth of wealth for an investor who put $1 in the S&P 500 Index in January 1926. Again, the chart lays out party control of Congress over time. And again, both parties have periods of significant growth and significant declines during their time of majority rule. However, there does not appear to be a pattern of stronger returns when any specific party is in control of Congress, or when there is mixed control for that matter. Markets have historically continued to provide returns over the long run irrespective of (and perhaps for those who are tired of hearing political ads, even in spite of) which party is in power at any given time.


Exhibit 2.       Hypothetical Growth of $1 Invested in the S&P 500 Index and Party Control of Congress
January 1926–August 2018

Past performance is not a guarantee of future results. Indices are not available for direct investment; therefore, their performance does not reflect the expenses associated with the management of an actual portfolio. S&P data © 2018 S&P Dow Jones Indices LLC, a division of S&P Global. All rights reserved.

Equity markets can help investors grow their assets, and we believe investing is a long-term endeavor. Trying to make investment decisions based on the outcome of elections is unlikely to result in reliable excess returns for investors. At best, any positive outcome based on such a strategy will likely be the result of random luck. At worst, it can lead to costly mistakes. Accordingly, there is a strong case for investors to rely on patience and portfolio structure, rather than trying to outguess the market, to pursue investment returns.


Source: Dimensional Fund Advisors LP.

Indices are not available for direct investment. Their performance does not reflect the expenses associated with the management of an actual portfolio. Past performance is not a guarantee of future results. Diversification does not eliminate the risk of market loss.

There is no guarantee investment strategies will be successful. Investing involves risks, including possible loss of principal. Investors should talk to their financial advisor prior to making any investment decision. There is always the risk that an investor may lose money. A long-term investment approach cannot guarantee a profit.

All expressions of opinion are subject to change. This article is distributed for informational purposes, and it is not to be construed as an offer, solicitation, recommendation, or endorsement of any particular security, products, or services. Investors should talk to their financial advisor prior to making any investment decision.

Six Simple Truths About Volatility

By | October 25th, 2018|Markets, Volatility|

Volatility is back. Just as many people were starting to think markets only ever move in one direction, the pendulum has swung the other way. Anxiety is a completely natural response to these events. Acting on those emotions, though, can end up doing us more harm than good.

There are a number of tidy-sounding theories about why markets have become more volatile. Among the issues frequently splashed across newspaper front pages: global growth fears, rising interest rates, policy uncertainty, geopolitical risk, and trade issues.

In some ways, the increase in volatility in recent weeks could be just as much a reflection of the fact that volatility has been very low for some time.

So, the increase in market volatility is an expression of uncertainty. Markets do not move in one direction. If they did, there would be no return from investing in stocks and bonds. And if volatility remained low forever, there would probably be more reason to worry.

As to what happens next, no one knows for sure. That is the nature of risk. In the meantime, investors can help manage their risk by diversifying broadly across and within asset classes.

For those still anxious, here are six simple truths to help you live with volatility:

1. Don’t make presumptions

Remember that markets are unpredictable and do not always react the way the experts predict they will.

2. Someone is buying

Quitting the equity market when prices are falling is like running away from a sale. While prices have been discounted to reflect higher risk, that’s another way of saying expected returns are higher. And while the media headlines proclaim that “investors are dumping stocks,” remember someone is buying them. Those people are often the long-term investors.

3. Market timing is hard

Recoveries can come just as quickly and just as violently as the prior correction. For instance, in March 2009—when market sentiment was at its worst—the S&P 500 turned and put in seven consecutive months of gains totaling almost 80%. This is not to predict that a similarly vertically shaped recovery is in the cards, but it is a reminder of the dangers for long-term investors of turning paper losses into real ones and paying for the risk without waiting around for the recovery.

4. Markets and economies are different things

The world economy is forever changing, and new forces are replacing old ones. This applies both between and within economies. For instance, falling oil prices can be bad for the energy sector but good for consumers. New economic forces are emerging, as global measures of poverty, education, and health improve.

5. Nothing lasts forever

Just as smart investors temper their enthusiasm in booms, they keep a reserve of optimism during busts. And just as loading up on risk when prices are high can leave you exposed to a correction, dumping risk altogether when prices are low means you can miss the turn when it comes. As always in life, moderation is a good policy.

6. Discipline is rewarded

The market volatility is worrisome, no doubt. The feelings being generated are completely understandable and familiar to those who have seen this before. But through discipline, diversification, and understanding how markets work, the ride can be made bearable. At some point, value re-emerges, risk appetites reawaken, and for those who acknowledged their emotions without acting on them, relief replaces anxiety.

If you’d like to discuss your specific investment situation, please do not hesitate to call our office.

All expressions of opinion are subject to change without notice. This article is distributed for informational purposes, and it is not to be construed as an offer, solicitation, recommendation, or endorsement of any particular security, products or services. Diversification does not eliminate the risk of market loss. There is no guarantee investment strategies will be successful. The S&P 500 Index is not available for direct investment and does not reflect the expenses associated with the management of an actual portfolio. Past performance is no guarantee of future results. Contributions from Dimensional Fund Advisors LP.

Park + Elm Investing Principle #8: Do Emotions Affect Investment Returns?

By | October 22nd, 2018|Markets|

PRINCIPLE #8 IS HERE!

Do Emotions affect Investment Returns!

Download the rest of our Ebook Here to get all 10 principles!!

Many people struggle to separate their emotions from investing. The chart above shows the correlation between emotional cycles and market returns. Investors typically buy at “Elation” and sell at “Fear”, inherently creating a dreaded “selling low, buying high” strategy.

A philosopher once said that nothing is as difficult for people as not deceiving themselves. But while most self-delusions are relatively costless, those relating to investment can come with a hefty price tag.

Market volatility in 2008 and 2009 took investors on a bumpy, emotional ride. Despite the market’s strong performance after March of 2009, many investors were too exhausted to endure the ongoing stress of an uncertain economy and market. By making an emotional decision to avoid the stress, there are millions of investors who never recovered their losses and sacrificed the enormous gains that would follow.

On the contrary – prior to the tech bubble of the early 2000’s, investors were pumping money into the dot coms because they saw their neighbor or co-worker getting rich. Driven by media and emotional investing, American’s poured their savings into tech stocks, only to endure the bubble bursting in 2000.

Some media outlets claim a similar bubble for tech stocks in ‘15 and ‘16. A Bing search on this claim literally pulled up the following article titles, one after another on page 1:

“Why this Tech Bubble is Worse than the Tech Bubble of 2000”

“Why this Tech Bubble is Less Scary than the Tech Bubble of 2000”

Magazines sell by appealing to the emotions of a reader. When it comes to investments, reacting to what you read or see on TV can be detrimental to your long-term retirement plan. Keep these tips in mind before making an emotional investment decision:

  1. Market timing is hard.
  2. Never forget the power of diversification.
  3. Markets and economies are different things.
  4. Discipline is rewarded.

Overcoming self-deception is not impossible. It just starts with recognizing that, as humans, we are not wired for disciplined investing. We will always find one way or another of rationalizing an emotional reaction to market events. But that’s why even experienced investors engage advisors who know them, and who understand their circumstances, risk appetites, and long-term goals. The role of your advisor is to listen to and acknowledge your very human fears, while keeping us in the plans we committed to at our most lucid and logical moments. Can you say with confidence that your investment decisions are based on a long-term strategy, or are your current emotions playing a role?

Quarterly Market Review: Q3-2018

By | October 8th, 2018|DFA, Dimensional Fund Advisors, Markets, Quarterly Market Review|

Click on the link below for a detailed analysis of quarterly performance of the global equity and fixed income markets.

CLICK HERE TO READ THE 3RD QUARTER 2018- QUARTERLY MARKET REVIEW

Total Cost of Ownership

By | October 3rd, 2018|Dimensional Fund Advisors, Markets|

Costs matter. Whether you’re buying a car or selecting an investment strategy, the costs you expect to pay are likely to be an important factor in making any major financial decision.

People rely on a lot of different information about costs to help inform these decisions. When you buy a car, for example, the sticker price indicates approximately how much you can expect to pay for the car itself. But the costs of car ownership do not end there. Taxes, insurance, fuel, routine maintenance, and unexpected repairs are also important considerations in the overall cost of a car. Some of these costs are easily observed, while others are more difficult to assess. Similarly, when investing in mutual funds, different variables need to be considered to evaluate how cost‑effective a strategy may be for a particular investor.

Expense ratios

Mutual funds have many costs, all of which affect the net return to investors. One easily observable cost is the expense ratio. Like the sticker price of a car, the expense ratio tells you a lot about what you can expect to pay for an investment strategy. Expense ratios strongly influence fund selection for many investors, and it’s easy to see why.

Exhibit 1 illustrates the outperformance rate, or the percentage of funds that beat their category index, for active equity mutual funds over the 15-year period ending December 31, 2017. To see the link between expense ratio and performance, outperformance rates are shown for quartiles of funds sorted by their expense ratio. As the chart shows, while active funds have mostly lagged indices across the board, the outperformance rate has been inversely related to expense ratio. Just 6% of funds in the highest expense ratio quartile beat their index, compared to 25% for the lowest expense ratio group.

This data indicates that a high expense ratio presents a challenging hurdle for funds to overcome, especially over longer time horizons. From the investor’s point of view, an expense ratio of 0.25% vs. 1.25% means savings of $10,000 per year on every $1 million invested. As Exhibit 2 helps to illustrate, those dollars can really add up over time.

Exhibit 1.       High Costs Can Reduce Performance, Equity Fund Winners and Losers Based on Expense Ratios (%)


Exhibit 2.      
Hypothetical Growth of $1 Million at 6%, Less Expenses

For illustrative purposes only and not representative of an actual investment. This hypothetical illustration is intended to show the potential impact of higher expense ratios and does not represent any investor’s actual experience. Assumes a starting account balance of $1 million and a 6% compound annual growth rate less expense ratios of 0.25%, 0.75%, and 1.25% applied over a 15-year time horizon. Performance of a hypothetical investment does not reflect transaction costs, taxes, other potential costs, or returns that any investor would have actually attained and may not reflect the true costs, including management fees of an actual portfolio. Actual results may vary significantly. Changing the assumptions would result in different outcomes. For example, the savings and difference between the ending account balances would be lower if the starting investment amount were lower.

Going beyond The expense ratio

The poor track record of mutual funds with high expense ratios has led many investors to select mutual funds based on expense ratio alone. However, as with a car’s sticker price, an expense ratio is not an all-encompassing measure of the cost of ownership. Take, for example, index funds, which often rank near the bottom of their peers on expense ratio.

Index funds are designed to track or match the components of an index formed by an index provider, such as Russell or MSCI. Important decisions in the investment process, such as which securities to include in the index, are outsourced to an index provider and are not within the fund manager’s discretion. For example, the prescribed reconstitution schedule for an index, which is the process of deleting or adding certain stocks to the index, may cause index funds to buy stocks when buy demand is high and sell stocks when buy demand is low. This price-insensitive buying and selling may be required so that the index fund can stay true to its investment mandate of tracking an underlying index. This can result in sub-optimal transaction prices for the index fund and diminished overall returns. In other words, for a given amount of trading (or turnover), the cost per unit of trading may be higher for such a strictly regimented approach to investing. Moreover, this cost will not appear explicitly to investors assessing such a fund on expense ratio alone. Further, because indices are reconstituted infrequently (typically once per year), funds seeking to track them may also be forced to buy and sell holdings based on stale eligibility criteria. For example, the characteristics of a stock considered value as of the last reconstitution date may change over time, but between reconstitution dates, those changes would not affect that stock’s inclusion or weighting in a value index. That means incoming cash flows to a value index fund could actually be used to purchase stocks that currently look more like growth stocks, and vice versa. Metaphorically, these managers’ attention may be more focused on the rear-view mirror than on the road ahead for investors.

For active approaches like stock picking, both the total amount of trading and the cost per trade may be high. If a manager trades excessively or inefficiently, costs like commissions and price impact from trading can eat away at returns. Viewed through the lens of our car analogy, this impact is like the toll on your vehicle from incessantly jamming the brakes or accelerating quickly. Subjecting the car to such treatment may result in added wear and tear and greater fuel consumption, increasing your total cost of ownership. Similarly, excessive trading can lead to negative tax consequences for a fund, which can increase the cost of ownership for investors holding funds in taxable accounts. Such trading costs can be reduced by avoiding unnecessary turnover and seeking to minimize the cost per trade.

In contrast to both highly regimented indexing and high-turnover active strategies, employing a flexible investment approach that reduces the need for immediacy, and thus enables opportunistic execution, is one way to potentially reduce implicit costs. Keeping turnover low, remaining flexible, and transacting only when the potential benefits of a trade outweigh the costs can help keep overall trading costs down and help reduce the total cost of ownership.

conclusion

The total cost of ownership of a mutual fund can be difficult to assess and requires a thorough understanding of costs beyond what an expense ratio can tell investors on its own. We believe investors should look beyond any one cost metric and instead evaluate the total cost of ownership of an investment solution.

Load More Posts