About Park-Elm

This author has not yet filled in any details.
So far Park-Elm has created 194 blog entries.

The Impact of Inflation

By | June 4th, 2018|DFA, Dimensional Fund Advisors|

ad5fab01-8626-413d-9b38-eebcddc089ea

JUNE 2018

WHEN THE PRICES OF GOODS AND SERVICES INCREASE OVER TIME, CONSUMERS CAN BUY FEWER OF THEM WITH EVERY DOLLAR THEY HAVE SAVED.

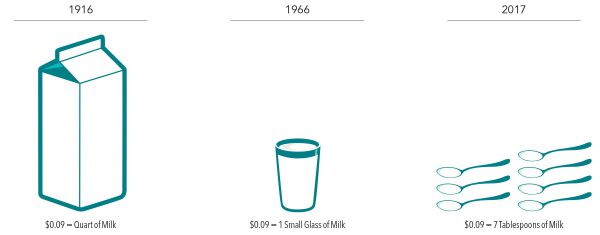
This erosion of the real purchasing power of wealth is called inflation. Inflation is an important element of investing. In many cases, the reason for saving today is to support future spending. Therefore, keeping pace with inflation is a crucial goal for many investors. To help understand inflation’s impact on purchasing power, consider the following illustration of the effects of inflation over time. In 1916, nine cents would buy a quart of milk. Fifty years later, nine cents would only buy a small glass of milk. And more than 100 years later, nine cents would only buy about seven tablespoons of milk. How can investors potentially prevent this loss of purchasing power from inflation over time?

Exhibit 1: Your Money Today Will Likely Buy Less Tomorrowinflation

In US dollars. Source for 1916 and 1966: Historical Statistics of the United States, Colonial Times to 1970/US Department of Commerce. Source for 2017: US Department of Labor, Bureau of Labor Statistics, Economic Statistics, Consumer Price Index—US City Average Price Data.

INVESTING FOR THE LONG TERM AND OTHER “TIPS”

As the value of a dollar declines over time, investing can help grow wealth and preserve purchasing power. Investors should know that over the long haul stocks have historically outpaced inflation, but there have also been short-term stretches where this has not been the case. For example, during the 17-year period from 1966–1982, the return of the S&P 500 Index was 6.8% before inflation, but after adjusting for inflation it was 0%. Additionally, if we look at the period from 2000–2009, the so-called “lost decade,” the return of the S&P 500 Index dropped from –0.9% before inflation to –3.4% after inflation.

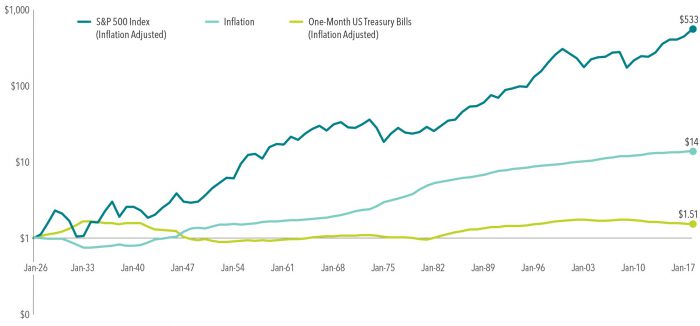
Despite some periods where stocks have failed to outpace inflation, one dollar invested in the S&P 500 Index in 1926, after accounting for inflation, would have grown to more than $500 of purchasing power at the end of 2017 and would have significantly outpaced inflation over the long run. The story for US Treasury bills (T-bills), however, is quite different. In many periods, T-bills were unable to keep pace with inflation, and an investor would have experienced an erosion of purchasing power. After adjusting for inflation, one dollar invested in T-bills in 1926 would have grown to only $1.51 at the end of 2017.

Exhibit 2: Growth of $1, 1926–2017

inflation2

S&P and Dow Jones data © 2018 Dow Jones Indices LLC, a division of S&P Global. All rights reserved. Past performance is no guarantee of future results. Actual returns may be lower. Inflation is measured as changes in the US Consumer Price Index.

While stocks are more volatile than T-bills, they have also been more likely to outpace inflation over long periods. The lesson here is that volatility is not the only type of risk that should concern investors. Ultimately, many investors may need to have some of their allocation in growth investments that outpace inflation to maintain their standard of living and grow their wealth.

One additional tool available to investors who are concerned about both stock market volatility and inflation are Treasury Inflation-Protected Securities (TIPS). TIPS are guaranteed by the US Treasury and as such are considered by the marketplace to have low risk of default. The Treasury issues TIPS with a variety of maturities, and these securities are easily bought and sold. Unlike traditional Treasury securities such as T-bills, TIPS are indexed to inflation to protect investors from an erosion in purchasing power. As inflation (measured by the consumer price index) rises, so does the par value of TIPS, while the interest rate remains fixed. This means that if inflation unexpectedly rises, the purchasing power of any principal invested in TIPS should also increase.[1] Although they may not offer the long-term growth opportunities that stocks do, their structure makes TIPS an effective risk management tool for investors who are concerned with managing uncertainty around future purchasing power.

CONCLUSION

Inflation is an important consideration for many long-term investors. By combining the right mix of growth and risk management assets, investors may be able to blunt the effects of inflation and grow their wealth over time. Remember, however, that inflation is only one consideration among many that investors must contend with when building a portfolio for the future. The right mix of assets for any investor will depend upon that investor’s unique goals and needs. A financial advisor can help investors weigh the impact of inflation and other important considerations when preparing and investing for the future.

[1]. Market prices incorporate market participants’ expectations about the future. Therefore, market participants’ expectations about future inflation should be incorporated into current prices. These expectations are referred to as expected inflation. Unexpected inflation refers to unexpected changes in inflation that deviate from prior market expectations. Unexpected inflation should be considered a primary driver of inflation risk.

Park + Elm Investing Principle #1: Embrace Market Pricing

By | May 25th, 2018|General, Markets|

Allocation Image


This is just #1!

Download our Ebook Here to get all 10 principles!!


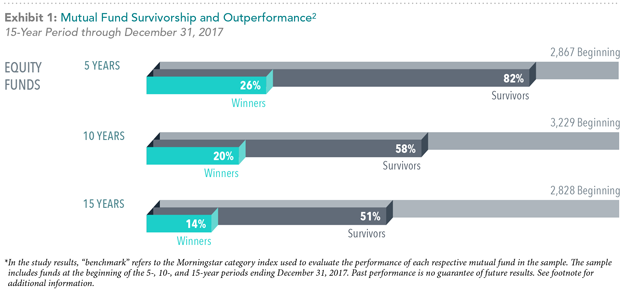
Many investors believe that there may be a way to predict when to buy and sell securities, and it’s possible that pricing errors occur in financial markets. But it’s clear that investors have a very difficult time consistently exploiting these errors. Over the last five years…


  1. About 60% of actively managed large cap US equity funds have failed to beat the S&P 500
  2. 77% of mid cap funds have failed to beat the S&P 400
  3. Two-thirds of the small cap manager universe have failed to outperform the S&P Small Cap 600 Index.
  4. Across the thirteen fixed income fund categories, all but one experienced at least a 70% rate of underperformance over five years.

…and the underperformance rate increases over longer periods of time. Most investors have investment time horizons much broader than 5 years, so trying to anticipate market movements over decades adds extreme anxiety and undue risk, while drastically increasing management expenses. Although the promise of above-market returns is alluring, investors must face the reality that as a group, US-based active managers do not consistently deliver on this promise, and they charge significantly higher fees for this underperformance.

Consider the assumption that the price of a security reflects all available information, and the intense competition among market participants drives prices to fair value. This type of strong belief in markets frees us to think and act differently about investing. When you try to outwit the market, you compete with the collective knowledge of millions of investors. By harnessing the Market’s power, you can put their knowledge to work in your portfolio.

Markets throughout the world have a history of rewarding investors for the capital they supply, and persistent differences in average portfolio returns are explained by differences in average risk. Attempting to time the market creates periods of time when investors are out of the market. This lack of participation can prove very costly to long-term returns. At Park and Elm, we embrace the market, and put investors in a position to capture returns from market growth over time, by pinpointing an acceptable level of risk, for an acceptable long-term return. There are periods of good and bad in the stock market, but it is by far the BEST investment option we have. Understanding that the price of a stock is driven to fair value by the intense competition of companies and investors, allows us to focus on controlling risk, lowering fees and diversifying into the broader markets.

INTERESTED IN THE REST OF THE INVESTING PRINCIPLES? DOWNLOAD OUR EBOOK HERE!

Today’s Video: Doing Better with Global Diversification

By | May 4th, 2018|General|

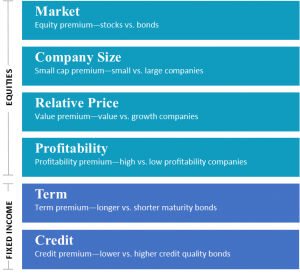
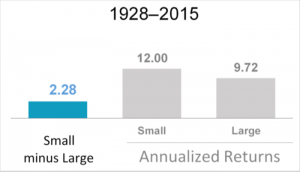
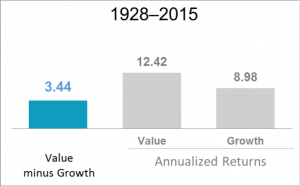
Over long periods of time, investors can benefit from consistent exposure in their portfolios to both U.S. and non-U.S. equities – large and small; value and growth. Check out this short video with Dimensional’s Joel Hefner explaining how diversifying globally and emphasizing the dimensions of higher expected returns can improve the chances of having a successful investment experience.

This is why Park + Elm is focused on designing globally diversified portfolios, minimizing investment costs and keeping our client’s risk tolerance at the forefront of our investment philosophy. Check out the examples in the video…

Video of the day: Tuning Out the Noise!

By | April 16th, 2018|DFA, Dimensional Fund Advisors, Markets, Video|

As an investor, it’s hard to stay focused on what really matters, and block out the constant noise. We believe the right financial advisor can get you closer to tuning it out! Check out the short video below to see why a more peaceful investment experience can be achieved!

Quarterly Market Review – 1st Quarter 2018

By | April 5th, 2018|General|

Q1 18

Click on the link below for a detailed analysis of quarterly performance of the global equity and fixed income markets.

CLICK HERE TO READ THE 1ST QUARTER 2018- QUARTERLY MARKET REVIEW

Video of the day – Dimensional on Volatility

By | March 15th, 2018|DFA, Markets, Video|

Check out this short piece from Dimensional Fund Advisors explaining why investors should view market declines as part of the nature of investing.


Today’s Clip: Things you CAN control in your Investment Portfolio

By | February 27th, 2018|DFA, Dimensional Fund Advisors, General, Markets, Video|

There are periods of good and bad in the stock market, but it is by far the BEST investment option we have. Understanding that the price of a stock is driven to fair value by the intense competition of companies and investors, allows us to focus on CONTROLLING what we can: RISK, FEES AND DIVERSIFICATION.

Click on the video image below to watch this short clip about focusing on the controllable things, and the importance of working with an advisor that understands you.

play-button-03

The Stock Market Sell Off…Will it Continue?

By | February 6th, 2018|General|

Side view of businessman using laptop with abstract business charts and diagrams on wooden desktop. Toned image

The U.S. stock market sell-off continued Monday with the Dow Jones Industrial Average suffering its biggest one-day point drop in history, plunging 1,175 points. The market gave back its 2018 gains as a flash-crash-style drop intensified a free fall in stocks that began last week. That leaves many investors worried and wondering what to do. Our firm is watching this situation very closely for our clients.

Why is this happening?
The stock market is still in midst of a 9-year bull market.  The S&P 500 spent the last 200+ days within 3% of all-time highs with no correction and gained over 22% in 2017.  Since President Trump was elected in November 2016, the DJIA has gained 45%, through its record closing high on January 26, 2018.

It’s important to remember that stocks will not go up forever.  Markets go up and down and this may be our wakeup call after 14 moths of gains. Most analysts consider this drop to be a normal correction, as opposed to a sign of a bear market. Many market watchers remained baffled about what prompted the sell-off since there was no major economic news or earnings reports from major companies on Monday.

Possible Factors in Sell-off

  1. Increase in interest rates – The 10-year Treasury bond yield rose to 2.85% on Monday, from 2.40% at the end of 2017.  Rising rates can put pressure on stocks.
  2. Inflation – There is a fear of spiking inflation, which can give cause for possible future rate increases.  Wage increases, while good for the economy, can also attribute to an inflationary environment.
  3. Bitcoin – The virtual currency has fallen from a high of $20,000 to less than $7,000.  This does not correlate directly with stocks, but can create an environment of negative sentiment for investors that have lost money in this asset class.
  4. HFT – Some of the late selling on Monday can be attributed to HFT (high frequency trading).  HFT is an automated trading platform used by large investment banks, hedge funds and institutional investors which utilize powerful computers to transact a large number of orders at high speeds.  These computers using algorithms to put in sell order.  Many orders hitting at once can magnify a sell-off.

Why the Bull Market May Continue 

While the sell-off can create some worry among investors, we want to shift the focus to the positives in the overall economy:

  • Corporate earnings and revenue growth are high
  • Low unemployment
  • Growing economy
  • Wage growth
  • Tax Reform and lower corporate tax rates

What to do?
Most likely, no action is needed.  Focus on why you are investing and your long-term goals.  We will work with our clients to make sure the current asset allocation (stocks verse bonds/cash) meets their risk tolerance.  Rebalance your portfolio when needed to bring back into alignment with the long-term plan.  Keep investment costs low and stay diversified. 

Our firm keeps the above principles at the forefront of our investment philosophy so our clients will be positioned well in volatile times.

Warren Buffett had this to say about a falling stock market…

“Don’t watch the market closely,” he advised those worried about their retirement savings. “If they’re trying to buy and sell stocks, and worry when they go down a little bit … and think they should maybe sell them when they go up, they’re not going to have very good results.  As long as you are invested appropriately for your goals, stay away from your investment portfolio.”

If you have any questions on your specific situation, please feel free to contact our office.

As Goes January, So Goes the Year?

By | January 30th, 2018|General|

As investors ring in the new year, some may see the occasional headline about the “January Indicator” or “January Barometer”.
This theory suggests that the price movement of the S&P 500 during the month of January may signal whether that index will rise or fall during the remainder of the year. In other words, if the return of the S&P 500 in January is negative, this would supposedly foreshadow a fall for the stock market for the remainder of the year, and vice versa if returns in January are positive.

So have past Januarys’ S&P 500 returns been a reliable indicator for what the rest of the year has in store?

If returns in January are negative, should investors sell stocks?

Exhibit 1. January Return vs. Subsequent 11-Month Return of the S&P 500 Index; 1926-2017

january

Exhibit 1 shows the monthly returns of the S&P 500 Index for each January since 1926, compared to the subsequent 11-month return (i.e., the return from February through December). A negative return in January was followed by a positive 11-month return about 60% of the time, with an average return during those 11 months of around 7%.

This data suggests there may be an opportunity cost for abandoning equity markets after a disappointing January. Take 2016, for example: The return of the S&P 500 during the first two weeks was the worst on record for that period, at -7.93%. Even with positive returns toward the end of the month, the S&P 500 returned -4.96% in January 2016, the ninth-worst January return observed from 1926 to 2017. But a subsequent rebound of 18% from February to December resulted in a total calendar year return of almost 13%. An investor reacting to January’s performance by selling out of stocks would have missed out on the gains experienced by investors who stuck with equities for the whole year. This is a good example of the potential negative outcomes that can result from following investment recommendations based on an “indicator.”

conclusion
Over the long term, the financial markets have rewarded investors. People expect a positive return on the capital they supply, and historically, the equity and bond markets have provided meaningful growth of wealth. As investors prepare for 2018 and what the year may bring, we should remember that frequent changes to an investment strategy can hurt performance. Rather than trying to beat the market based on hunches, headlines, or indicators, investors who remain disciplined can let markets work for them over time.

Quarterly and Annual Market Review for Q4-2017

By | January 8th, 2018|General, Markets, Quarterly Market Review|

News concept: circuit board with Growth Graph icon, 3d render

Click on the link below for a detailed analysis of quarterly and annual performance of the global equity and fixed income markets.

CLICK HERE TO READ THE 4th QUARTER 2017 –  QUARTERLY/ANNUAL MARKET REVIEW

Load More Posts