A quick online search for “Dow rallies 500 points” yields a cascade of news stories with similar titles, as does a similar search for “Dow drops 500 points.”
These types of headlines may make little sense to some investors, given that a “point” for the Dow and what it means to an individual’s portfolio may be unclear. The potential for misunderstanding also exists among even experienced market participants, given that index levels have risen over time and potential emotional anchors, such as a 500-point move, do not have the same impact on performance as they used to. With this in mind, we examine what a point move in the Dow means and the impact it may have on an investment portfolio.
Impact of index construction
The Dow Jones Industrial Average was first calculated in 1896 and currently consists of 30 large cap US stocks. The Dow is a price-weighted index, which is different than more common market capitalization-weighted indices.
An example may help put this difference in weighting methodology in perspective. Consider two companies that have a total market capitalization of $1,000. Company A has 1,000 shares outstanding that trade at $1 each, and Company B has 100 shares outstanding that trade at $10 each. In a market capitalization-weighted index, both companies would have the same weight since their total market caps are the same. However, in a price-weighted index, Company B would have a larger weight due to its higher stock price. This means that changes in Company B’s stock would be more impactful to a price-weighted index than they would be to a market cap-weighted index.
The relative advantages and disadvantages of these methodologies are interesting topics themselves, but the main purpose of discussing the differences in this context is to point out that design choices can have an impact on index performance. Investors should be aware of this impact when comparing their own portfolios’ performance to that of an index.
Headlines vs. reality
Movements in the Dow are often communicated in units known as points, which signify the change in the index level. Investors should be cautious when interpreting headlines that reference point movements, as a move of, say, 500 points in either direction is less meaningful now than in the past largely because the overall index level is higher today than it was many years ago.
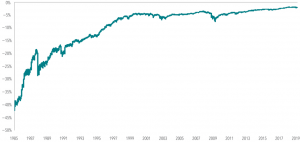
Exhibit 1 plots what a decline of this magnitude has meant in percentage terms over time. A 500-point drop in January 1985, when the Dow was near 1,300, equated to a nearly 39% loss. A 500-point drop in December 2003, when the Dow was near 10,000, meant a much smaller 5% decline in value. And a 500-point drop in early December 2018, when the Dow hovered near 25,000, resulted in a 2% loss.
Exhibit 1. Hypothetical 500-Point Decline of the Dow Measured in Percentage Terms
How does the dow relate to your portfolio?
While the Dow and other indices are frequently interpreted as indicators of broader stock market performance, the stocks composing these indices may not be representative of an investor’s total portfolio.
For context, the MSCI All Country World Investable Market Index (MSCI ACWI IMI) covers just over 8,700 large, mid, and small cap stocks in 23 developed and 24 emerging markets countries with a combined market cap of more than $50 trillion. The S&P 500 includes 505 large cap US stocks with approximately $23.8 trillion in combined market cap. The Dow is a collection of 30 large cap US stocks with a combined market cap of approximately $6.8 trillion.
Exhibit 2. Performance of MSCI ACWI IMI, S&P 500, and Dow by Calendar Year
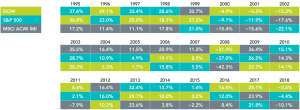
Dow Jones and S&P 500 data © 2019 S&P Dow Jones Indices LLC, a division of S&P Global. All rights reserved. MSCI data © MSCI 2019, all rights reserved. MSCI ACWI IMI is the MSCI All Country World Investable Market Index (net dividends). Their performance does not reflect fees and expenses associated with the management of an actual portfolio. Past performance is no guarantee of future results.
It is also important to note that some investors may be concerned about other asset classes besides stocks. Depending on investor needs, a diversified portfolio may include a mix of global stocks, bonds, commodities, and any number of other assets not represented in a stock index. A portfolio’s performance should always be evaluated within the context of an investor’s specific goals. Understanding how a personal portfolio compares to broadly published indices like the Dow can give investors context about how headlines apply to their own situation.
Conclusion
News headlines are often written to grab attention. A headline publicizing a 500-point move in the Dow may trigger an emotional response and, depending on the direction, sound either exciting or ominous enough to warrant reading the article. However, after digging further, we can see that the insights such headlines offer may be limited, especially if investors hold portfolios designed and managed daily to meet their individual goals, needs, and preferences in a broadly diversified and cost-effective manner.

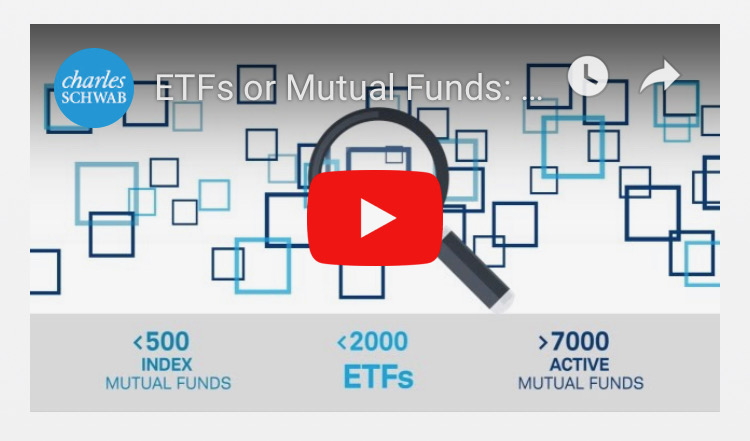
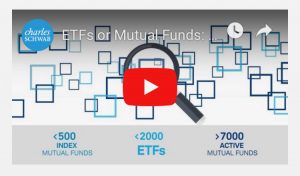 Our partners at Charles Schwab produced this short video to help explain the difference between Exchange Traded Funds (ETF’s) and Mutual Funds. It’s common amongst investors to have little understanding of the difference between the two. There are times when it makes sense to choose one over the other. Timing, taxes and expenses are all factors.