It’s Enrollment Time! Here’s What you Need to Know!

Fall is open enrollment in the American workplace, and you’ve probably already received you packets, forms, memos, meeting invites and apps for the benefits enrollment season. Navigating your benefits package can be overwhelming, and has a direct effect on your long-term savings. Park + Elm wants to help. Below is your quick guide to navigating your benefits booklet from start to finish:
Health Insurance – pay close attention to the following variables to the health insurance options:
- Coverage – compare what’s covered to your anticipated needs, i.e. maternity?
- Co-payments and Prescriptions – if you go to the doctor often, or have a recurring prescription to fill, evaluate these fees closely.
- Deductibles – the amount you have to pay out of your pocket before coverage begins. A high deductible plan typically means lower premiums, but participants pay more out of pocket if an unexpected illness occurs.
- Premiums – the monthly fee for coverage. A higher premium usually means lower deductibles, co-pays and more coverage. But that’s not always the best financial choice.
Tax advantaged accounts – beyond health coverage, these accounts allow you to save pre-tax dollars for ancillary health and other expenses.
- FSA (Flexible Savings Account) – similar in tax savings, a FSA allows you to use the funds for medical and child care services. There are limits to contributions and to carry over funds.
- HSA (Health Savings Account) – contribute to this account to help cover medical expenses you are paying out of pocket. Choosing a high deductible plan warrants opening an HSA due to the anticipated higher out of pocket costs. These funds roll over from year-to-year.
Vision and Dental – Simply put…
- Dental care is expensive. Insurance doesn’t cover a lot, but what it does cover usually outweighs the cost of the dental care without it.
- Vision care is inexpensive, but sometimes unnecessary. If you have healthy eyes you need a checkup only every 2 years, so vision premiums may not be worth it.
Life and Disability – Important Voluntary Benefits!!!
- Short-term Disability – are you covered for a short-term illness or injury?
- Long-term Disability – if you are unable to work for an extended period of time, how will you pay your bills?
- Life Insurance – How much should you leave your family if something happens to you?
401(k) – the likely #1 source of retirement savings, this benefit is the major player in your ability to retire. (Please Note: Contribution Limits are increased for 2019)
- Make a goal to increase your contributions every year
- Take full advantage of your employer’s match
- Make catch-up contributions if you are eligible
- Evaluate the need to defer some of your funds to a Roth 401(k) to provide future tax diversification.
- Evaluate your risk tolerance and allocate appropriately
- Choose low-cost funds
The best way to make the most of open enrollment is to simply set aside adequate time to review all your options carefully and ask any questions you may have. Consult with your financial advisor, as these benefits choices will affect your long-term savings. To make the most of open enrollment, read the fine print, consider your family’s needs and make an educated, rather than a rash, decision. We are here to help you navigate these important choices. Please let us know if you would like a more detailed COMPLIMENTARY REVIEW of your benefits booklet!


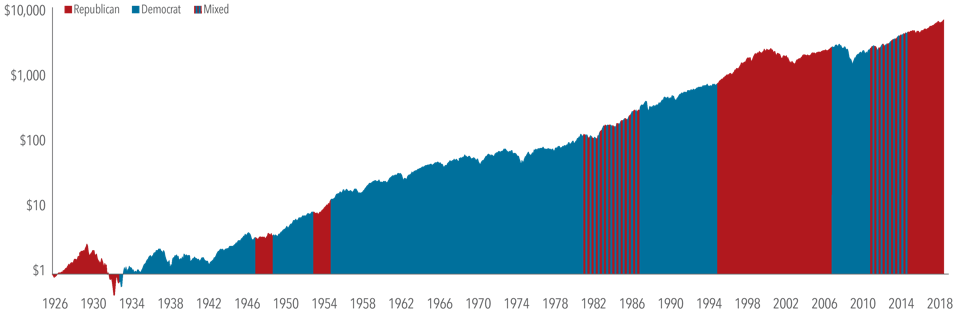


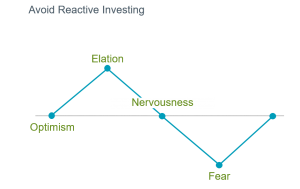 Volatility is back. Just as many people were starting to think markets only ever move in one direction, the pendulum has swung the other way. Anxiety is a completely natural response to these events. Acting on those emotions, though, can end up doing us more harm than good.


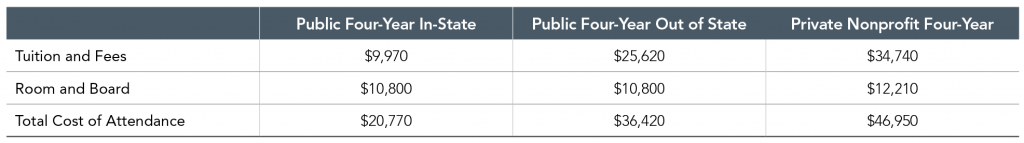
![educ]](https://park-elm.com/wp-content/uploads/2018/09/educ-300x201.jpg) With school back in session in most of the country, many parents are likely thinking about how best to prepare for their children’s future college expenses. NOW is a good time to sharpen one’s pencil for a few important lessons before heading back into the investing classroom to tackle the issue.
With school back in session in most of the country, many parents are likely thinking about how best to prepare for their children’s future college expenses. NOW is a good time to sharpen one’s pencil for a few important lessons before heading back into the investing classroom to tackle the issue.