From 1928–2017 the value premium in the US had a positive annualized return of approximately 3.5%. In seven of the last 10 calendar years, however, the value premium in the US has been negative.
This has prompted some investors to wonder if such an extended period of underperformance may be cause for concern. But are periods of underperformance in the value premium that unusual? We can look to history to help make sense of this question.
short-term results
Exhibit 1 shows yearly observations of the US value premium going back to 1928. We can see the annual arithmetic average for the premium is close to 5%, but in any given year the premium has varied widely, sometimes experiencing extreme positive or negative performance. In fact, there are only a handful of years that were within a 2% range of the annual average—most other years were farther above or below the mean. In the last 10 years alone there have been premium observations that were negative, positive, and in line with the historical average. This data helps illustrate that there is a significant amount of variability around how long it may take a positive value premium to materialize.
Exhibit 1: Yearly Observations of Premiums, Value minus Growth: US Markets, 1928–2017
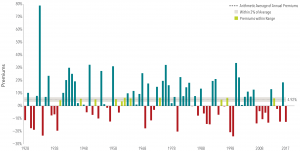
In US dollars. The one-year relative price premium is computed as the one-year compound return on the Fama/French US Value Research Index minus the one-year compound return on the Fama/French US Growth Research Index. Fama/French indices provided by Ken French.Indices are not available for direct investment. Their performance does not reflect the expenses associated with the management of an actual portfolio. Past performance is no guarantee of future results.
long-term results
But what about longer-term underperformance? While the current stretch of extended underperformance for the value premium may be disappointing, it is not unprecedented. Exhibit 2 documents 10-year annualized performance periods for the value premium, sorted from lowest to highest by end date (calendar year).
Exhibit 2: Historical Observations of 10-Year Premiums, Value minus Growth:
US Markets 10-Year Periods ending 1937–2017
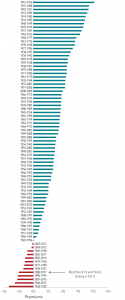
This chart shows us that the best 10-year period for the value premium was from 1941–1950 (at top), while the worst was from 1930–1939 (at bottom). In most cases, we can see that the value premium was positive over a given 10-year period. As the arrow indicates, however, the value premium for the most recent 10‑year period (ending in 2017) was negative. To put this in context, the most recent 10 years is one of 13 periods since 1937 that had a negative annualized value premium. Of these, the most recent period of underperformance has been fairly middle-of-the-road in magnitude.
In US dollars. The 10-year rolling relative price premium is computed as the 10-year annualized compound return on the Fama/French US Value Research Index minus the 10-year annualized compound return on the Fama/French US Growth Research Index. Fama/French indices provided by Ken French. Indices are not available for direct investment. Their performance does not reflect the expenses associated with the management of an actual portfolio. Past performance is no guarantee of future results.
While there is uncertainty around how long periods of underperformance may last, historically the frequency of a positive value premium has increased over longer time horizons. Exhibit 3 shows the percentage of time that the value premium was positive over different time periods going back to 1926. When the length of time measured increased, the chance of a positive value premium increased. For example, when the time period measured goes from five years to 10 years, the frequency of positive average premiums increased from 75% to 84%.
Exhibit 3: Historical Performance of Premiums over Rolling Periods, July 1926–December 2017
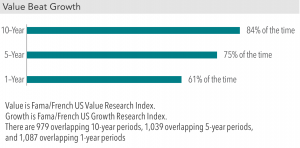 In US dollars. Based on rolling annualized returns using monthly data. Rolling multiyear periods overlap and are not independent. Fama/French indices provided by Ken French. Indices are not available for direct investment. Their performance does not reflect the expenses associated with the management of an actual portfolio. Past performance is no guarantee of future results.
conclusion
What does all of this mean for investors? While a positive value premium is never guaranteed, the premium has historically had a greater chance of being positive the longer the time horizon observed. Even with long-term positive results though, periods of extended underperformance can happen from time to time. Because the value premium has not historically materialized in a steady or predictable fashion, a consistent investment approach that maintains emphasis on value stocks in all market environments may allow investors to more reliably capture the premium over the long run. Additionally, keeping implementation costs low and integrating multiple dimensions of expected stock returns (such as size and profitability) can improve the consistency of expected outperformance.