Pursuing a Better Investment Experience #5 – Consider the Drivers of Returns
Throughout history, many of the greatest advancements in finance have come from Academia. Our investment philosophy has been shaped by decades of research by leading academics. We structure portfolios on the principles that markets are efficient; that returns are determined by asset allocation decisions, and that portfolios can be structured around dimensions of expected returns identified through academic research. It is through our strategic partnership with Dimensional Fund Advisors, a leading global investment firm that has been translating academic research into practical investment solutions since 1981, that we can pursue dimensions of higher expected returns through advanced portfolio design, management, and trading.
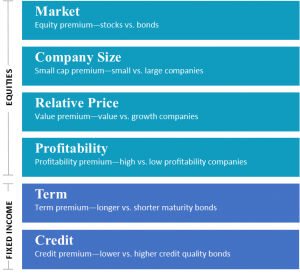
Much of what we have learned about expected returns in the equity and fixed income markets can be summarized in these dimensions.
- Stocks have higher expected returns than bonds – it has been well documented over time that stocks outperform bonds, and that risk = reward
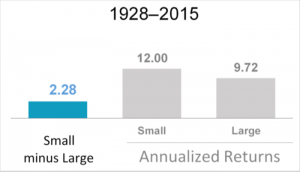
- Among stocks, expected return differences are largely driven by company size – small companies have higher expected returns than large companies.
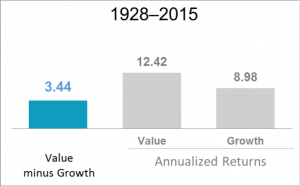
- Relative price – low relative price “value” companies have higher expected returns than high relative price “growth companies.
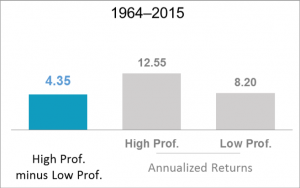
- Profitability – companies with high profitability have higher expected returns than companies with low profitability.
Since 1981, Dimensional has incorporated rigorous academic research on the capital markets into the design, management, and trading of clients’ portfolios. Some of the major milestones in academic research shown in the chart below have had a profound effect on our investment philosophy.
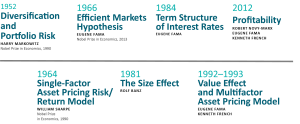
Our enduring philosophy and deep working relationships with Dimensional and the academic community underpin our approach to investing. Over a long period of time, Academics have been able to identify dimensions of higher expected returns, and with Dimensional, we can structure portfolios around these dimensions in a very cost-effective manner.
Information provided by Dimensional Fund Advisors LP.
US size premium: Dimensional US Small Cap Index minus S&P 500 Index. US relative price premium: Fama/French US Value Index minus Fama/French US Growth Index. US profitability premium: Dimensional US High Profitability Index minus Dimensional US Low Profitability Index. Dev. ex US size premium: Dimensional Intl. Small Cap Index minus MSCI World ex USA Index (gross div.). Dev. ex US relative price premium: Fama/French International Value index minus Fama/French International Growth Index. Dev. ex US profitability premium: Dimensional International High Profitability Index minus Dimensional International Low Profitability Index. Emerging Markets size premium: Dimensional Emerging Markets Small Cap Index minus MSCI Emerging Markets Index (gross div.). Emerging Markets relative price premium: Fama/French Emerging Markets Value Index minus Fama/French Emerging Markets Growth Index. Emerging Markets profitability premium: Dimensional Emerging Markets High Profitability Index minus Dimensional Emerging Markets Low Profitability Index. Profitability is measured as operating income before depreciation and amortization minus interest expense scaled by book. Indices are not available for direct investment. Their performance does not reflect the expenses associated with the management of an actual portfolio. Past performance is not a guarantee of future results. Index returns are not representative of actual portfolios and do not reflect costs and fees associated with an actual investment. Actual returns may be lower. See “Index Descriptions” for descriptions of Dimensional and Fama/French index data. Dimensional Fund Advisors LP. The S&P data is provided by Standard & Poor’s Index Services Group. MSCI data © MSCI 2016, all rights reserved.


