Park + Elm Investing Principle #9: Look Beyond the Headlines

PRINCIPLE #9 IS HERE!
Look Beyond the Headlines!!
Download the rest of our Ebook Here to get all 10 principles!!
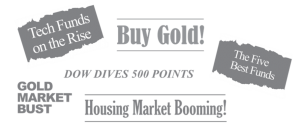
Daily market news and commentary can challenge your investment discipline. Some messages stir anxiety about the future while others tempt you to chase the latest investment fad. When tested, consider the source and maintain a long-term perspective.
Why doesn’t the media run more good news? Because bad news sells! It sells because fear is a more powerful emotion than greed. If people preferred good news, the media would supply it. Newspaper editors know it, which is why the front pages are often so depressing.
When the readers are investors, the danger can come when the emotions generated by bad news prompt them to make changes to their portfolios, unaware that the news is likely already built into market prices. For the individual investor seeking to make portfolio decisions based on news, this presents a real challenge. First, to profit from news you need to be ahead of the market. Second, you have to anticipate how the market will react. This does not sound like a particularly reliable investment strategy. Take, for instance, these headlines from the last presidential election:
Trump’s win turns stock market into shock market, CBS News
A Trump win means recession, stock market crash , CNBC
Yet after some brief jitters following Trump’s win, the stock market kept marching skyward. By the time Trump clinched the presidency, the market rallied and closed the trading day 256 points higher, and continued the rally for 2 years. From Trump’s election to Mid-term elections, the S&P 500 gained nearly 25%.
Take also the summer of 2015, when Greece was on a fast track to bankruptcy. Media around the world described the financial crisis to come in Greece, yet the following year, Greece was the #1 performing stock market in the world.
Conversely, what about those EXTREME jackpot prediction headlines:
Six Stocks to Kick Start Your Portfolio
Make Money in Any Market
12-Month Get Rich Plan
In early 2013, the Daily Mail in the UK carried the headline, “Gold Set to Shine Even More Brightly in 2013.” The rationale was that with investors scouring the world for “safe havens,” gold could reach as high as $2,500 an ounce by year end. As it turned out, gold suffered its biggest annual loss in three decades that year, with its spot price falling 28% in US dollar terms. From an all-time high of $1,920 in September 2011, gold fell to just over $1,200 by the end of 2013.
The notion that the path to long-term wealth lies in locating secret and previously undiscovered treasures in the global marketplace of securities is one regularly featured in media and market commentary. It’s a haphazard approach, reliant on chance and requiring a lot of work that is unlikely to be rewarded. Worse, it means taking unnecessary risks by tying one’s fortunes to a handful of securities or to one or two sectors.
A BETTER APPROACH
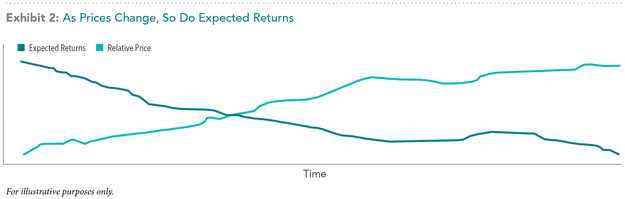
Luckily, there is better approach to investing. It involves working with the market and accepting that news is quickly built into prices. Those prices, which are forever changing, reflect the collective views of all market participants and reveal information about expected returns. So instead of trying to second-guess the market by predicting news, investors can use the information already reflected in prices to build diverse portfolios based on the dimensions that drive higher expected returns.
WHAT SHOULD YOU DO?
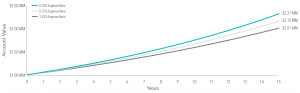
Sound investment boils down to a handful of principles – accepting that markets work, understanding that risk and return are related, diversifying, keeping costs low and maintaining a long-term perspective. You should turn off MSNBC and Mad Money and work with an Adviser to develop an investment strategy that fits YOUR financial goals for your family and retirement.


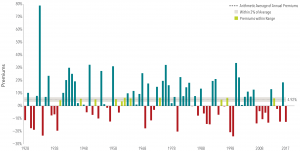
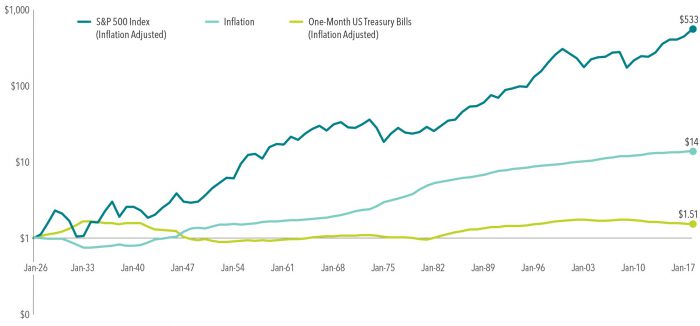
 In US dollars. Based on rolling annualized returns using monthly data. Rolling multiyear periods overlap and are not independent. Fama/French indices provided by Ken French. Indices are not available for direct investment. Their performance does not reflect the expenses associated with the management of an actual portfolio. Past performance is no guarantee of future results.
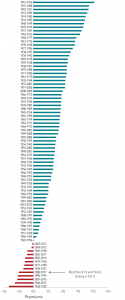