About Park-Elm

This author has not yet filled in any details.
So far Park-Elm has created 181 blog entries.

Quarterly Market Review – Q3 2020

By | October 7th, 2020|DFA, Dimensional Fund Advisors, Markets|

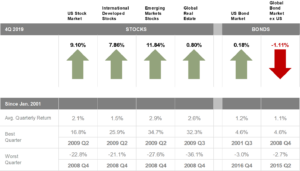
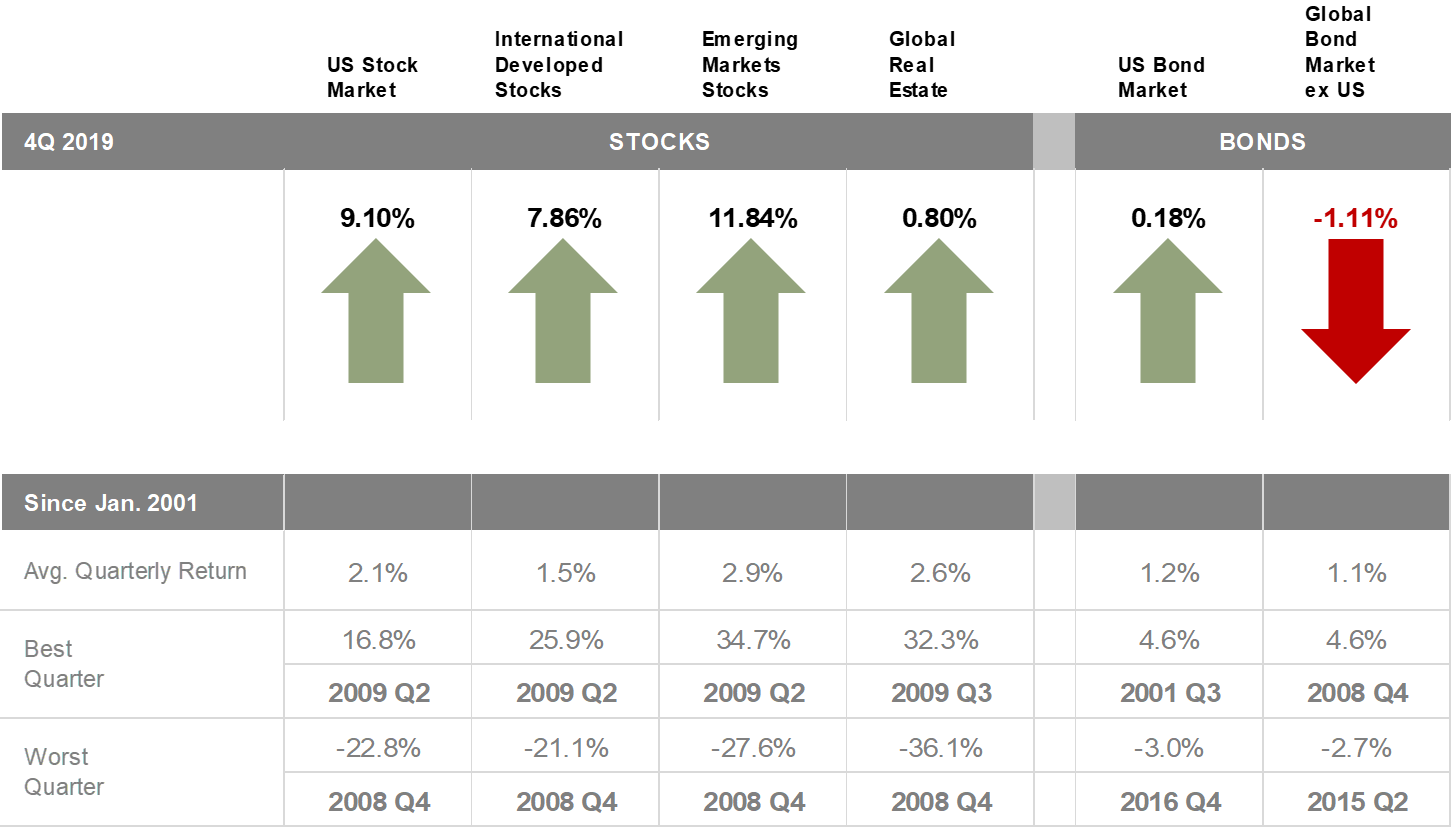
This report features world capital market performance and a timeline of events for the past quarter. It begins with a global overview, then features the returns of stock and bond asset classes in the US and international markets.

The report also illustrates the impact of globally diversified portfolios and features a quarterly topic.

Click HERE to download this quarter’s breakdown!

What History Tells Us About US Presidential Elections and the Market

By | October 2nd, 2020|Markets|

It’s natural for investors to seek a connection between who wins the White House and which way stocks will go. But a look at history underscores that shareholders are investing in companies, not a political party.

What History Tells Us About US Presidential Elections and the Market

How Much Impact Does the President Have on Stocks?

By | October 2nd, 2020|Markets|

How Much Impact Does the President Have on Stocks


Click HERE to download this interactive exhibit that examines market and economic data for nearly 100 years of US presidential terms.


Park + Elm ADV

By | August 5th, 2020|Markets|

Form ADV 2A & 2B - 2.13.20

Park + Elm Privacy Policy

By | August 5th, 2020|Markets|

Privacy Policy - 2.13.20 (1)

U.S. Equity Performance Dashboard – July 2020

By | August 5th, 2020|Markets|

  • In spite of weak macroeconomic data and fears of a resurgence of COVID-19, U.S. equities continued their rally in July, aided by Fed stimulus and strong earnings results  The S&P 500® gained by 6%, while the S&P MidCap 400® and the S&P SmallCap 600® gained by 5% and 4%, respectively. The total return for the S&P 500 is now modestly positive year to date. Volatility declined, with the VIX® closing the month at 24.46.
  • International markets also gained, with especially strong performance in the emerging markets. The S&P Developed Ex-U.S. BMI and S&P Emerging BMI were up 3% and 8%, respectively.
  • With the exception of Enhanced Value, all factor indices posted gains, with Momentum and Low Volatility in the lead. Consumer Discretionary and Utilities were the top performing sectors.


dashboard-us-2020-07

U.S. Performance Dashboard – April 2020

By | May 4th, 2020|Markets|

  • After March’s carnage, U.S. equities roared back in April, driven by fiscal stimulus and the apparent slowing of the spread of COVID-19. The S&P 500® gained by 13%, the best monthly performance since January 1987. In a reversal from the recent past, mid-caps performed even better, with the S&P MidCap 400® up 14%. While still relatively high, volatility calmed, with the VIX® closing the month at 34.15.
  • International markets also recovered, with the S&P Developed Ex-U.S. BMI and S&P Emerging BMI up 8% and 10%, respectively.
  • All factors and sectors posted gains, with High Beta and Growth in the lead, followed by Equal Weight, thanks to the recovery of smaller-caps.  After suffering this year and in spite of the volatility of oil prices,  Energy made a comeback as the top performing sector.
dashboard-us-2020-04

U.S. Performance Dashboard – March 2020

By | April 2nd, 2020|Markets|

  • Global markets in Q1 were devastated by the coronavirus pandemic. U.S. equities posted their worst quarter since 2008, with the S&P 500® down 20%; smaller-caps performed even worse, with the S&P MidCap 400® and the S&P SmallCap 600® down 30% and 33%, respectively. Volatility rose, with the VIX® closing at a record high of 82.69 on March 16th.
  • International markets were not spared, with the S&P Developed Ex-U.S. BMI and S&P Emerging BMI down 24% and 25%, respectively.
  • While all factors and sectors posted losses, Momentum, Growth, Quality and Low Volatility managed to outperform the market.  Info Tech and Health Care were the top performing sectors, while Energy was the laggard, down an astonishing 50% as a result of the plunge in oil prices.

dashboard-us-2020-03

Epidemics and Stock Market Performance

By | March 30th, 2020|Markets|

Clients and Friends:

Our firm is busy monitoring the current market conditions, events and client accounts.  Here is a brief overview of recent events:

Last week was one for the history books. Tuesday: the highest percentage gain for the Dow since 1933.  Thursday: record new unemployment benefit claims of 3.3 million—doubling some estimates. In the end, the Dow finished the week in the green.

Dow Jones Industrial Average*
  Monday Tuesday Wednesday Thursday Friday The Week
Point
Change
-582 +2,113 +496 +1,352 -915 +2,463
Percentage
Change
-3.0% +11.4% +2.4% +6.4% -4.0% +12.8%
 
Notes on recent events:

  • The Federal Reserve raised its response to the coronavirus crisis to a whole new level, with its open-ended QE as well as unprecedented purchases of short-dated IG corporate debt and ETFs, measures that had not been adopted even at the height of the global financial crisis.
  • The decision to purchase ETFs expands the purchase of IG debt to longer maturities. Together, these measures show that the Fed understands the need for a creative, decisive and adaptive strategy to fight the current crisis.
  • The Fed announced a raft of new measures and facilities aimed at: 1) providing targeted relief to affected households and businesses; 2) giving broad support to economic activity; and 3) ensuring the smooth functioning of money and credit markets. These include:
    • Open-ended QE. It announced it will purchase Treasuries and agency MBS “in the amounts needed” to keep markets functioning smoothly and ensuring monetary policy can do its job.
    • New facilities to support credit to households and businesses with up to $300 billion in new financing.
    • Expansion of [liquidity facilities] to a wider range of securities.
    • Planned launch of a program to support lending to small- and medium-sized businesses.
  • We think the Fed’s support can help the US economy survive the shock and set the stage for a strong recovery in the second half of the year, on two conditions:
    • One: the government-mandated shutdown of large parts of the economy is sufficiently short-lived. 
    • Two: Congress follows suit and launches a sizable package of fiscal measures, and remains committed to implementing all measures that may be needed to weather this exogenous shock.
  • Update as of 3/27 – Congress negotiated a $2 trillion relief bill this week, the largest stimulus package in US history, that has now passed the House and Senate—and was signed by the President into law.

Market updates:

  • In terms of where the markets go from here, our base case is U-shaped recovery; likely with some significant ups and downs during this phase. A quick V-shaped recovery seems unlikely barring an antiviral breakthrough.
  • The delay in rebound is because the demand shock should lead to business and household stress that, in turn, leads to higher unemployment and defaults. This puts “stickier” downward pressure on aggregate demand in the recovery phase. On the positive side, our base case is that we experience the worst of the virus before the second quarter of 2020 is over.
  • As we’ve often discussed, we recognize that while we can’t control returns, we certainly can control risks. Even in these uncertain times, we seek to build well-diversified, low-cost portfolios.
 
We will continue to monitor the situation and make any recommendations that we deem appropriate, but given that your goals and time horizons haven’t changed, we believe the current strategy remains the best course of action.


WEATHERING THE CORONAVIRUS

By | March 14th, 2020|Markets|

Weathering-the-coronavirus
Load More Posts